Olá pessoal,
Boa noite!
Neste post vou demonstrar uma ferramenta utilizada por 99.99% dos DBA’s SQL Server ao redor do mundo e provavelmente você já a conhece, que é a excelente e famosíssima stored procedure sp_WhoIsActive, do Adam Machanic, que nos permite obter uma série de informações sobre as sessões ativas de uma instância SQL Server como a query que está sendo executada, o usuário que está executando, o evento de wait, tempo de execução, uso de CPU, uso de Tempdb, leituras em disco (IO) e muito mais coisas.
O objetivo desse post é demonstrar essa ferramenta e como os diferentes parâmetros e personalizações alteram o resultado final da Stored Procedure. Hoje em dia, muitos DBA’s utilizam essa SP sempre com os parâmetros padrão, seja por falta de conhecimento sobre os parâmetros ou mesmo da existência deles.
Antes de iniciar, vou disponibilizar aqui a última versão da sp_WhoIsActive para vocês baixarem, caso não estejam conseguindo baixar no site do Adam Machanic.
UPDATE: No dia 25/07/2017 eu disponibilizei uma query que seria uma “versão compacta” (lite) da sp_WhoIsActive. Dá uma conferida neste post.
Caso você esteja visitando esse artigo em busca de dicas de performance, dê uma lida também na minha série de artigos sobre esse assunto:
– Entendendo o funcionamento dos índices no SQL Server
– SQL Server – Comparação de performance entre Scalar Function e CLR Scalar Function
– SQL Server – Introdução ao estudo de Performance Tuning
– SQL Server – Como identificar uma query lenta ou pesada no seu banco de dados
Espero que vocês gostem dessa série 🙂
Um pouco mais sobre a sp_WhoIsActive
Descrição das colunas Utilizando a ajuda da sp_WhoIsActiveConsultando a ajuda da sp_WhoIsActive
Essa ferramenta possui sua própria ajuda, e podemos acessá-la utilizando o parâmetro @help = 1:
|
1 |
EXEC sp_whoIsActive @help = 1 |
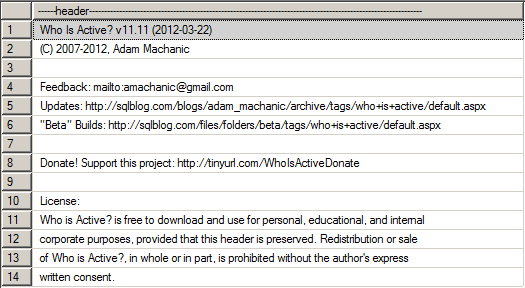
e a saída é divida em 3 resultsets:
Informações sobre o criador da SP
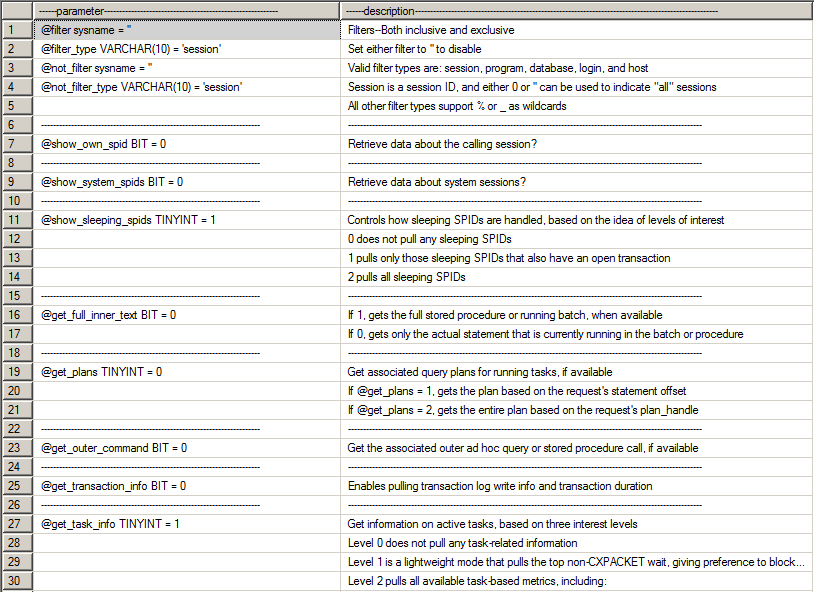
Descrição dos parâmetros da chamada da SP
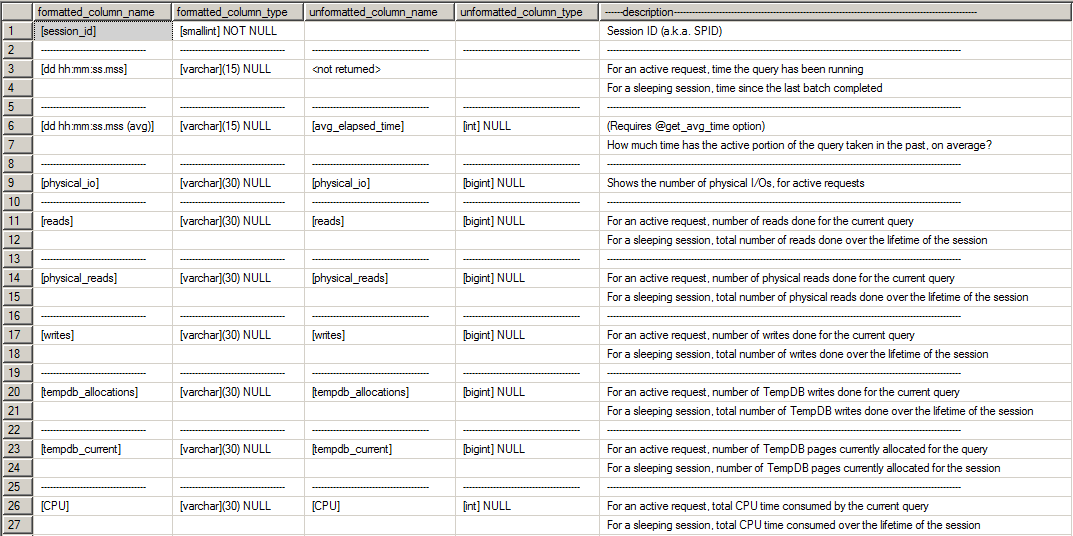
Descrição das colunas retornadas pela SP
Permissões mínimas necessárias para executar a SP
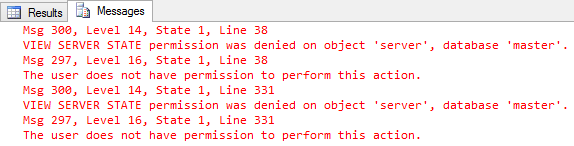
Um dos pontos importantes a se comentar, são as permissões mínimas necessárias para se utilizar a sp_WhoIsActive. Já vi muitos DBA’s concederem acesso de sysadmin para um usuário, para que ele possa utilizar essa SP, por não conhecer o que é necessário liberar para que o usuário execute a Stored Procedure na instância, visto que o mais comum, é tentar liberar apenas a permissão de EXECUTE na Stored Procedure.
Caso você não libere a permissão de view server state, você verá a mensagem de erro abaixo:
Para isso, basta executar o comando abaixo, para que o usuário consiga utilizar a sp_WhoIsActive normalmente:
|
1 2 3 4 5 |
USE [master] GO GRANT EXECUTE ON dbo.sp_WhoIsActive TO [dominio\usuario] GRANT VIEW SERVER STATE TO [dominio\usuario] GO |
Utilizando parâmetros na sp_WhoIsActive
Execução padrão, sem parâmetrosParte 1:

Parte 2

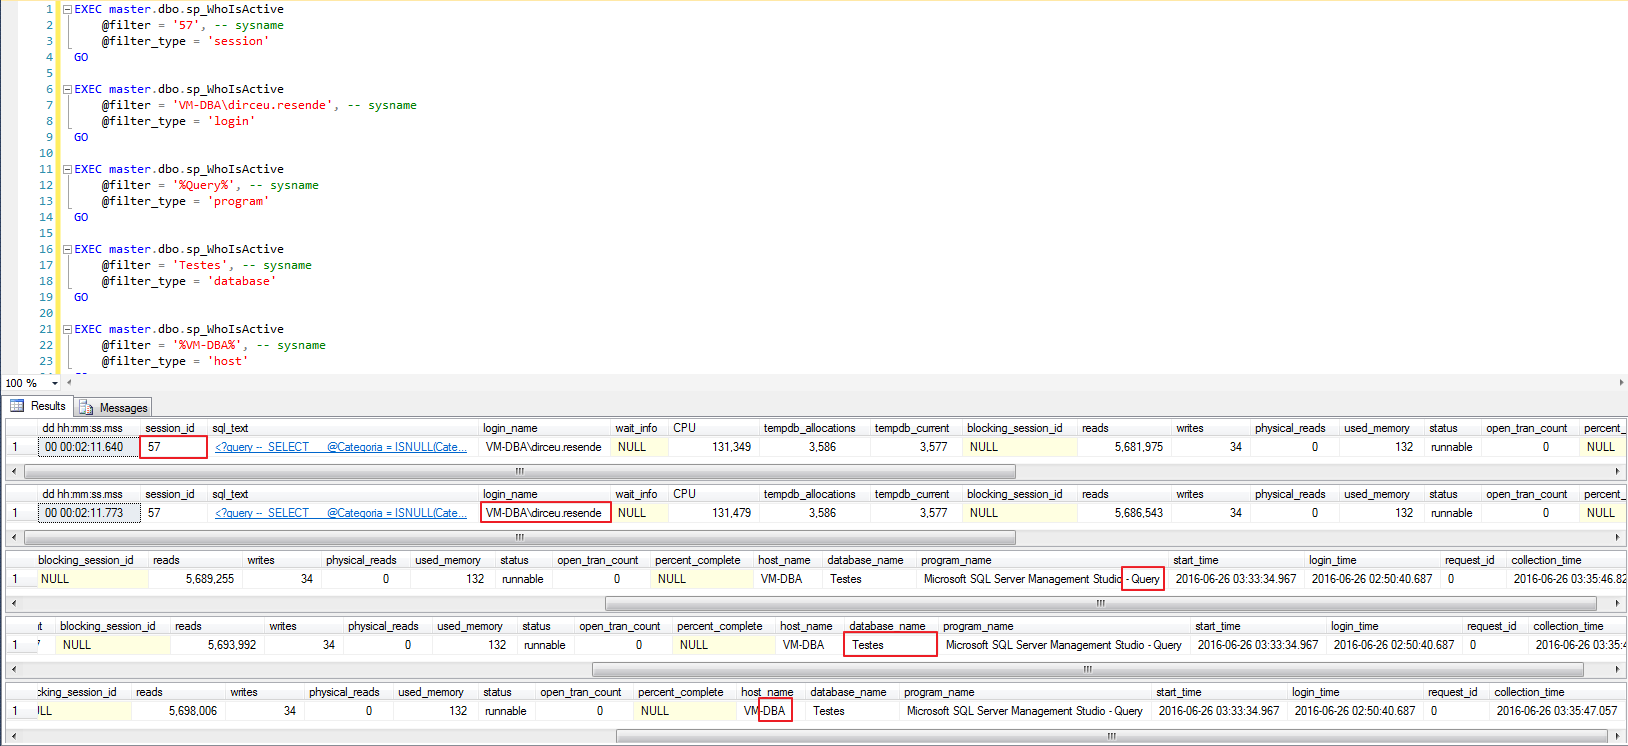
O parâmetro @filter nos permite definir o que queremos buscar (suporta o wildcard % para realizar buscas como LIKE ‘%string%’), enquanto o parâmetro @filter_type permite definir onde queremos buscar essa informação. Os tipos possíveis para o @filter_type são:
- session: Permite pesquisar por uma sessão específica
- program: Permite buscar sessões que esteja utilizando um determinado software client para conexão com o banco de dados
- database: Esse tipo de filtro é utilizado para filtrar queries sendo executadas em um determinado database
- login: Filtro utilizado para filtrar as sessões de um determinado usuário
- host: Utilize esse filtro para visualizar apenas as sessões vindas de um hostname específico
Exemplos do uso de filtros inclusivos (@filter e @filter_type):
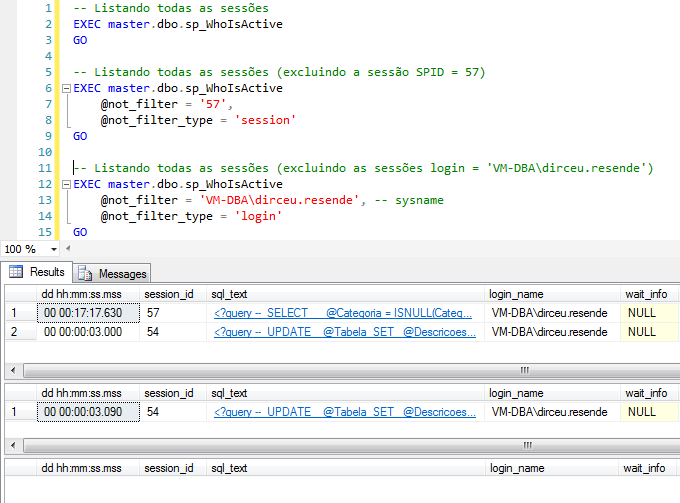
Exemplos do uso de filtros exclusivos (@not_filter e @not_filter_type):
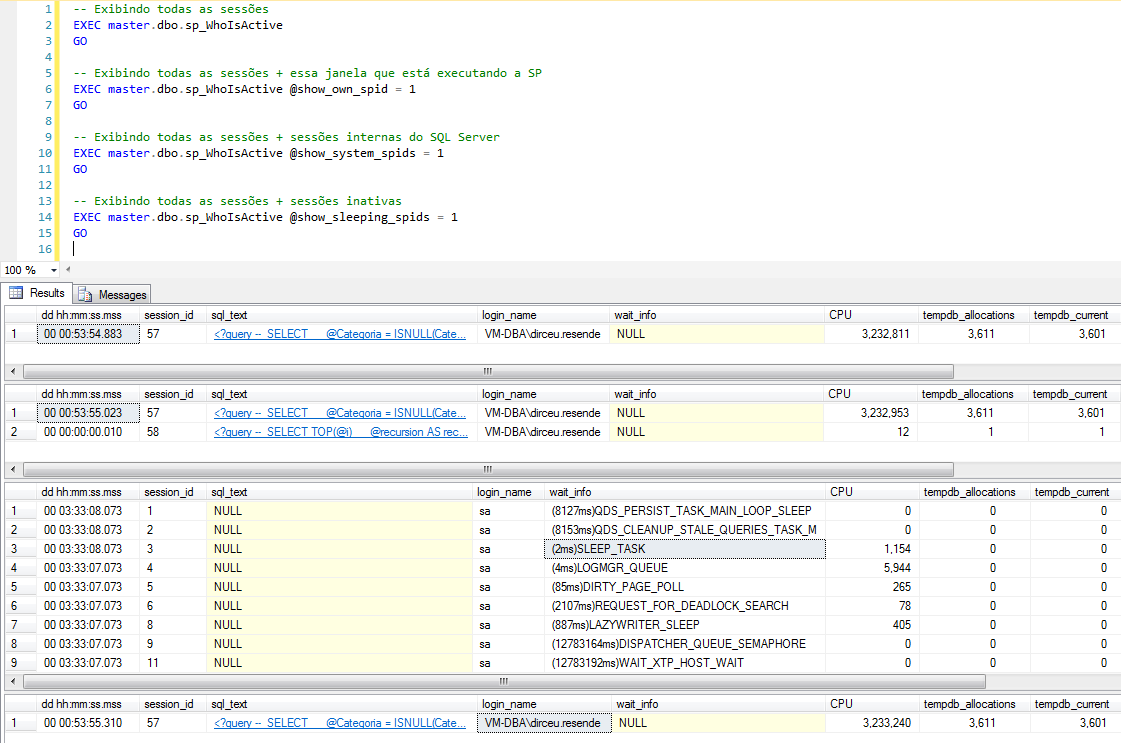
O parâmetro @show_own_spid (BIT) determina se a própria sessão que está executando a procedure fará parte do resultado final que será mostrado na tela. O valor padrão é 0 (zero), fazendo com que a própria sessão não seja mostrada por padrão.
O parâmetro @show_system_spids (BIT) determina se as sessões internas de sistema do SQL Server serão exibidas no resultado final da SP. O valor padrão é 0 (zero), fazendo com que essas sessões sejam ignoradas.
O parâmetro @show_sleeping_spids (TINYINT) determina se as sessões inativas (sleeping) serão exibidas no resultado final da SP. O valor padrão é 0 (zero), fazendo com que essas sessões sejam ignoradas. O valor 1 exibe todas as sessões inativas que possuem transação aberta e o valor 2 exibe todas as sessões inativas.
Exemplos de uso:
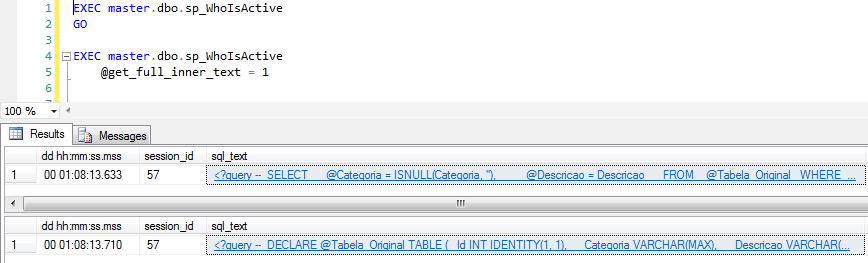
@get_full_inner_text
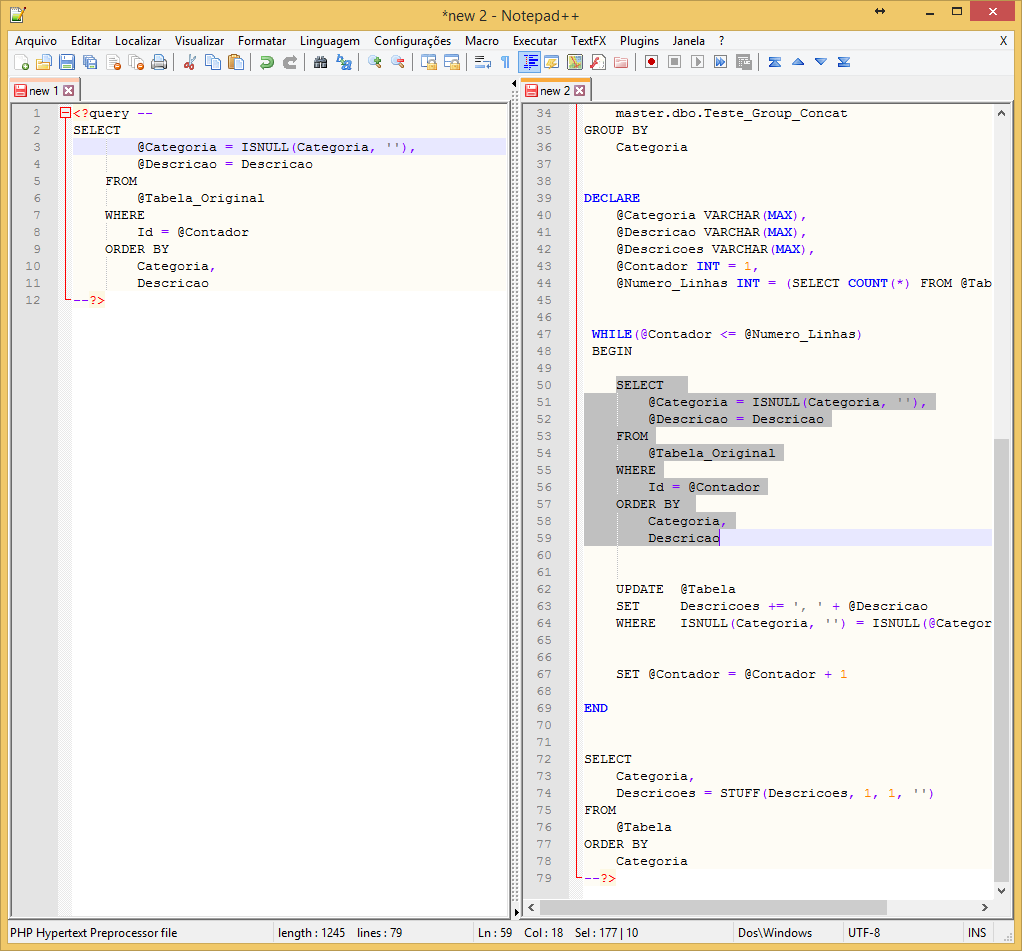
Por padrão, a instrução SQL que é retornada em forma de XML na coluna sql_text é apenas o trecho (batch) que está sendo processado no momento. Ao utilizar esse parâmetro, podemos observar todo o conteúdo do batch que foi enviado para o processamento do SQL Server.
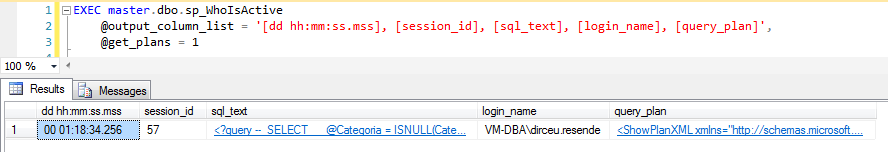
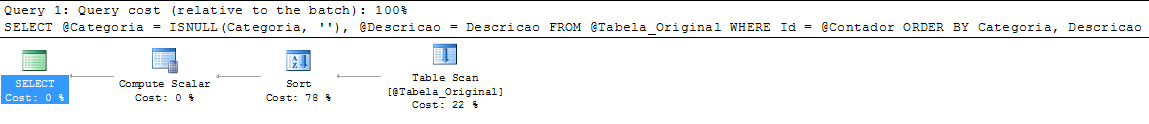
@get_plans
Ao utilizar esse parâmetro com o valor 1, será gerado uma demonstração do plano de execução da query atual de cada sessão retornada por essa SP. Utilizando o valor 2 nesse parâmetro, é gerado o plano de execução de toda a query das sessões. Ao clicar no XML do ResultSet, o Management Studio já exibe o plano de execução dessa query. Fantástico!
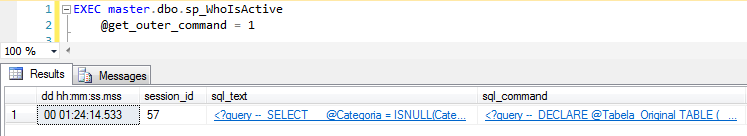
@get_outer_command
Esse parâmetro é parecido com o @get_full_inner_text, mas ao invés de substituir o valor da coluna sql_text, ele mantém essa coluna com seu valor padrão (apenas o trecho em execução) e adiciona uma nova coluna chamada sql_command, que contém toda a query que a sessão está executando. Desta forma, temos as duas visões.
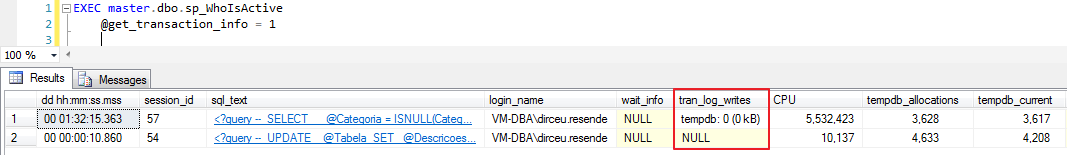
@get_transaction_info
Com a utilização desse parâmetro, podemos visualizar a quantidade e volume de dados escritos no log de transação de cada sessão.
@get_task_info
Parâmetro muito interessante para análise de performance, o @get_task_info permite visualizar mais informações sobre as sessões em execução. Ao utilizar o valor 1, podemos visualizar o maiores eventos de wait (que não sejam CXPACKET).
Ao utilizar o parâmetro 2, vamos visualizar o modo completo, que incluí as colunas:
- physicial_io: Mostra o números de leituras/escritas (I/O) físicas no disco
- context_switches: Mostra o número de mudanças de contextos para a conexão ativa. Uma mudança de contexto é quando o kernel do SO troca o processador de uma thread por outra (ex: uma thread de maior prioridade).
Esse indicador é muito importante para identificar se um processo está usando mais o CPU que os outros processos e impedindo que eles cheguem ao processador. Um índice muito alto, quer dizer que está ocorrendo muita concorrência no processador e ele pode estar sobrecarregado. Um número baixo, significa que algum processo está alocando mais o CPU que deveria, gerando muito tempo de wait (e provavelmente sessões com status Pending e Runnable).
Os valores esperados devem ser algo abaixo de 2.000 trocas por processador/segundo (alguns DBA’s consideram um valor abaixo de 5.000 como aceitável). Valores muito altos podem estar sendo causados por falhas de alocação de memória física (RAM). Um outro possível agravante é a tecnologia Intel® Hyper-Threading, que em alguns casos pode causar muitas mudanças de contexto por conta da simulação de núcleos virtuais. Caso esteja passando por esse problema, um bom teste é desativar esse recurso na placa mãe do servidor e realizar testes de performance.
- tasks: Numero de tarefas sendo utilizadas pela execução atual.
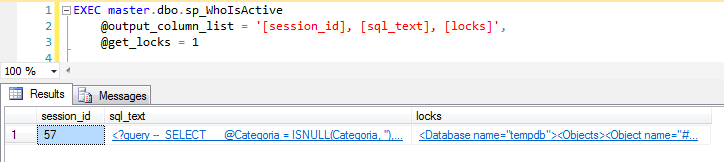
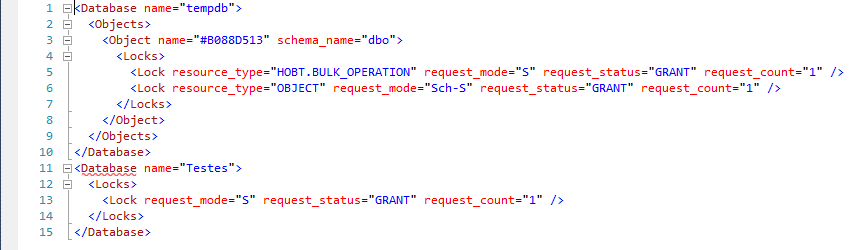
@get_locks
Parâmetro muito útil para manutenção e identificação de locks na instância. Quando ativado, mostra os objetos reservados de cada requisição, bem como o tipo de bloqueio solicitado pela sessão.
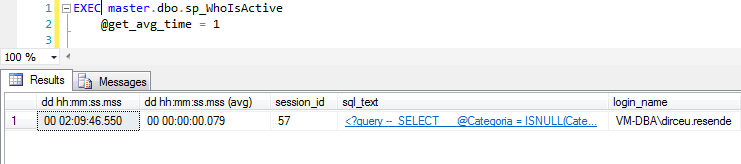
@get_avg_time
Com a utilização desse parâmetro, surge uma nova coluna no resultado final (dd hh:mm:ss.mss (avg)). Essa coluna mostra o tempo médio de execução da query atual em execução por cada sessão. Como vocês podem observar no exemplo, a minha query está em execução há mais de 2h, mas o trecho atual está demorando em média, 79 ms, em um looping de 850.000 iterações. Esse tempo é estimado baseado no plano e históricos de execução.
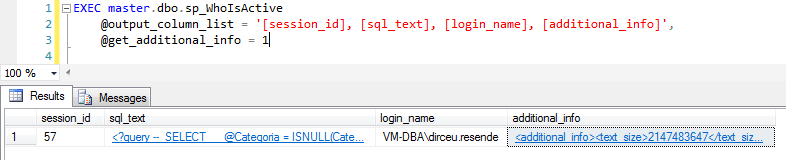
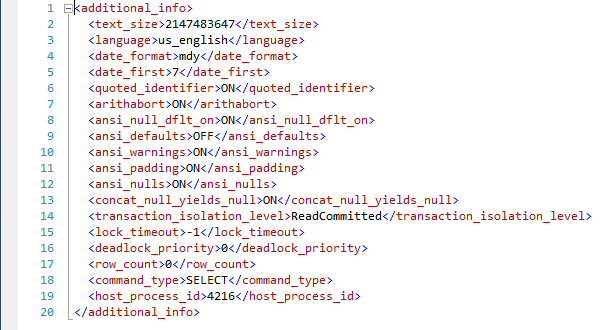
@get_additional_info
Com a utilização desse parâmetro, será criada uma nova coluna no resultado final chamada “additional_info”, que é um XML com várias informações e definições de comandos SET de cada sessão, conforme o exemplo abaixo:
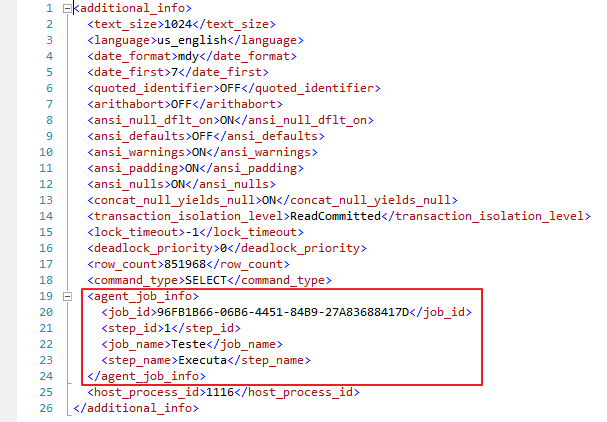
Caso algum job do SQL Server Agent esteja em execução, a coluna additional_info dessa sessão que o Job abriu terá as informações do Job:
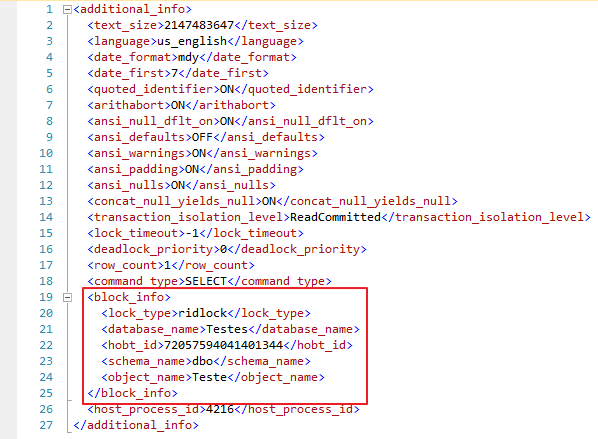
Caso você utilize os parâmetros @get_task_info = 2 e @get_additional_info = 1 e houver um lock em alguma sessão, o XML da coluna “additional_info” dessa sessão que está em lock terá um nó chamado block_info com as informações do block:
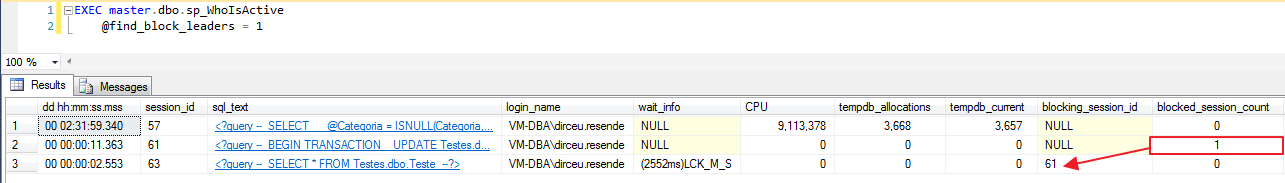
@find_block_leaders
Um dos meus parâmetros preferidos, o @find_block_leaders quando ativado, permite analisar cada sessão e contar quantas outras sessões estão em lock aguardando a liberação de objetos por essa sessão. Sabe quando começam eventos de lock na sua instância de produção e você tem que ficar procurando quem que está causando esses locks? Esse parâmetro é a solução para você.
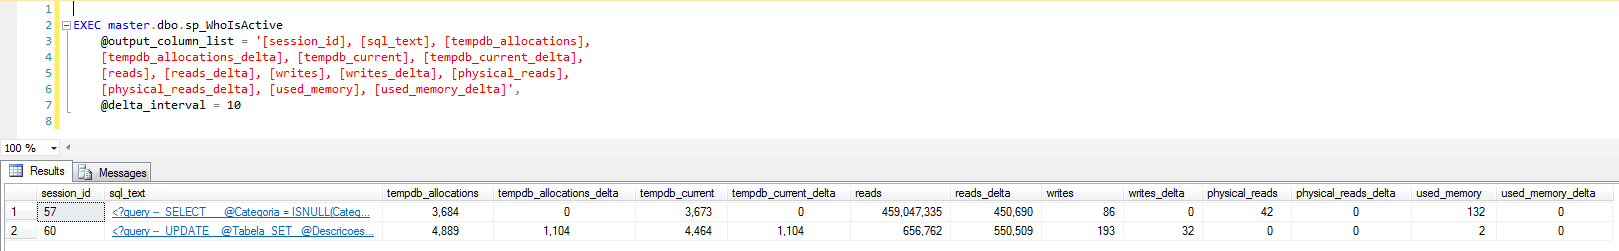
@delta_interval
Esse recurso interessante serve para que você consiga realizar duas coletas de dados em um determinado período de tempo (esse período é o valor do parâmetro, em segundos) e analisar a diferença de alocação de tempdb, leituras, escritas, etc.. entre as duas coletas realizadas.
No exemplo abaixo, especifiquei um intervalo de 10 segundos entre cada coleta. Ao final dos 10 segundos, serão criadas colunas com o sufixo “_delta”, demonstrando a diferença entre a primeira e a segunda execução.
Isso é muito útil para analisar crescimento de alocação de tempdb ou leituras em disco em tempo real. Muitas vezes, analisando apenas a alocação total da sessão e a atual não é o bastante para se estimar o crescimento e alocação de recursos, fazendo deste recurso muito interessante para os DBA’s.
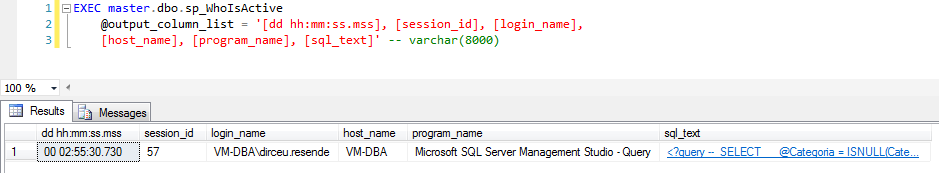
@output_column_list
Como já demonstrei em alguns exemplos acima, esse parâmetro serve para definir quais colunas devem fazer parte do resultado final da execução da SP.
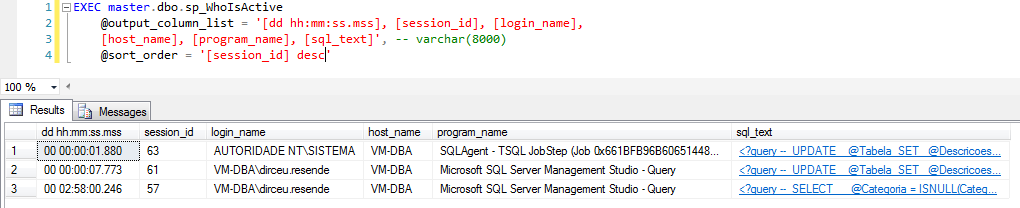
@sort_order
Como o próprio nome sugere, esse parâmetro serve para ordenar os resultados conforme a sua necessidade, onde você escolher quais colunas utilizar para a ordenação e qual o critério (asc ou desc).
@format_output
Esse parâmetro serve para alterar a forma de visualização de algumas colunas para um modo mais “humano” de leitura. Com o valor 1, o formato de saída utilizará fontes de comprimento variável. Com o valor 2, o formato de saída utilizará fontes de comprimento fixo.
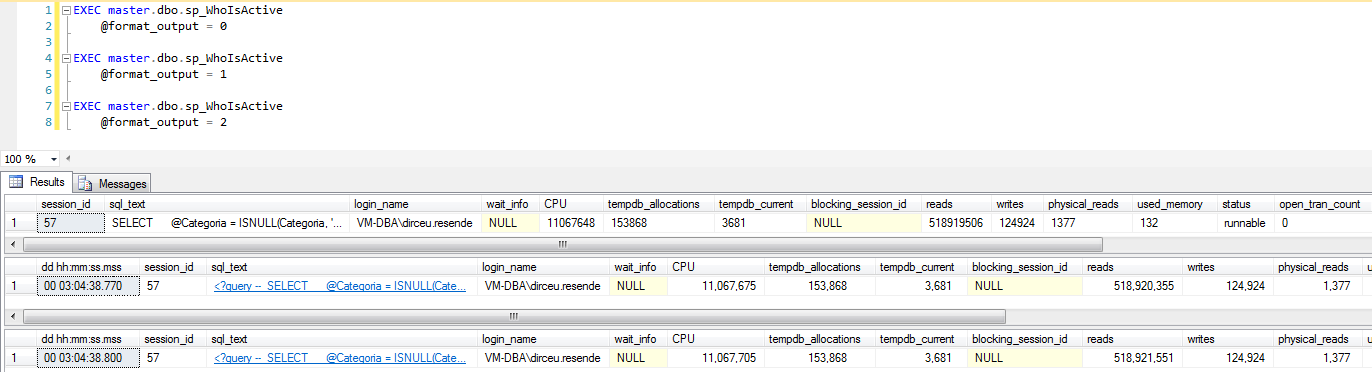
Sendo sincero, vejo diferenças entre o valor 0 e 1, mas não vejo diferenças entre os valores 1 e 2.
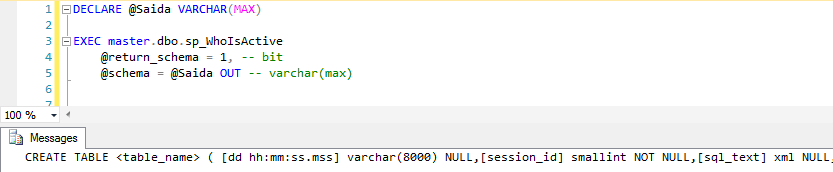
@return_schema e @schema
Esses parâmetros em conjunto servem para gerar o script de criação do resultado da SP. O parâmetro @return_schema quando setado para 1, ao invés de retornar o resultado da execução, gera o script de CREATE TABLE do resultado. Esse script deve ser lido utilizando uma variável de OUTPUT no parâmetro @schema, conforme demonstrado abaixo:
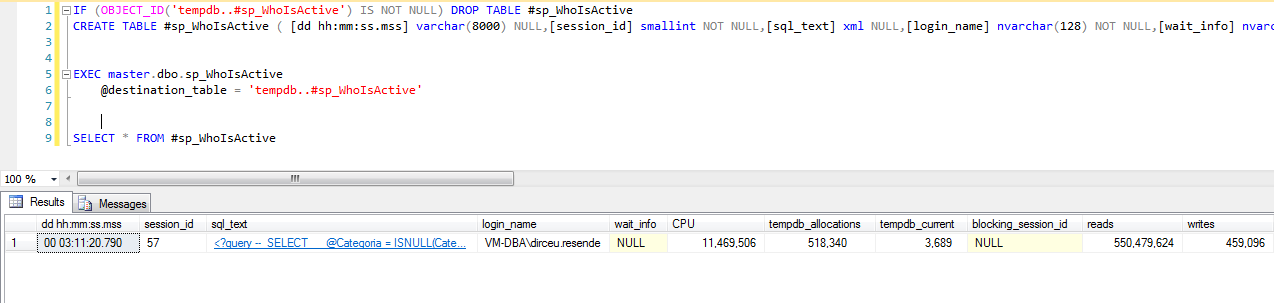
@destination_table
E por último, temos o parâmetro @destination_table. Ele serve para inserir o resultado da execução da SP em uma tabela física, onde podemos armazenar de histórico e consultar quando quisermos.
Para utilizar esse parâmetro, a tabela deve estar criada previamente, pois esse parâmetro vai apenas inserir os dados, não vai criar a tabela. Para obter o comando de CREATE TABLE resultante da execução dessa SP, basta olhar os parâmetros explicados logo acima (@return_schema e @schema) para fazer isso de forma fácil e em poucos segundos.
É isso aí pessoal!
Espero que esse post seja útil para vocês.
Po mano, tu é fera demais… parabéns, uma pena só ter conhecido seu conteudo agora.
Parabéns pelo post Dirceu!!! Conteúdo enriquecedor!!!
Apesar de já utilizar esta proc a anos, aprendi algumas coisas aqui com o teu post esclarecedor. Parabéns Dirceu!
Excelente post
Obrigado, José Carlos.
Fico feliz que você tenha gostado
Muito bom. Me ajudou um tanto.
Parabéns pelo post!
Dirceu, parabéns por mais um Post. Iniciei a pouco tempo no mundo SQL… Acompanho sempre suas postagens e dicas do SQLManiacs (Whatsapp). Você me ajuda, e ajuda muita gente tmb.
Dirceu,
Estava procurando mais informações sobre a proc e foi muito bom ver seu post sobre ela! Muito completo!
Parabéns pelo post!
abraço!
Luis, que bom que você gostou. Qualquer dúvida, é só falar.
Caro Dirceu, Muito bom o seu post. Bem explicado e com muitas imagens. Parabens!
Bruno, fico muito feliz por você ter gostado. Espero que meu blog lhe seja útil em outras oportunidades e obrigado pelo feedback. Abraço.
Amigo estou tendo dificuldades uso dessa store procedure, executo e o resultado vem vazio, só é mostrado os cabeçalho dos campos, você poderia me auxilar?
Danilo, bom dia!
Qual a versão e edição do SQL Server você está utilizando ?