Hey Guys!
Tudo tranquilo com vocês ?
Neste post, eu gostaria de apresentar a vocês uma ferramenta muito útil no dia a dia de quem trabalha com Performance Tuning e precisa, constantemente, ativar as opções STATISTICS TIME e/ou IO para visualizar algumas informações sobre essas consultas que podem auxiliar na atividade de otimização da consulta (Quer algumas dicas sobre Performance Tuning? Acesse este post).
Quem já utilizou esses parâmetros do comando SET, sabe que muitas vezes, a formatação da saída não é muito intuitiva, principalmente quando existem várias consultas no statement, utilizando diversas tabelas, dificultando um pouco o entendimento dessa informação.
Para nos ajudar nesse estudo de Performance Tuning, o Richie Rump desenvolveu uma aplicação Web onde você cola a saída (output) da aba Messages do SQL Server Management Studio (SSMS) e essa ferramenta converte as informações no formato de tabelas HTML, permitindo uma visualização clara, objetiva e limpa, e de quebra, nos permitindo ordenar as informações, como pela quantidade de logical reads, por exemplo.
Caso você queira conhecer e começar a utilizar o Statistics Parser, basta acessar o link http://statisticsparser.com/.
Exemplo de uso
Vou demonstrar um exemplo prático de como a ferramenta Statistics Parser facilita a análise dessa saída
Saída padrão do STATISTICS TIME e STATISTICS IO
|
1 2 3 4 5 6 7 8 9 10 11 12 13 14 15 16 17 18 19 20 21 22 23 24 25 26 |
SQL Server parse and compile time: CPU time = 31 ms, elapsed time = 103 ms. SQL Server Execution Times: CPU time = 0 ms, elapsed time = 0 ms. SQL Server Execution Times: CPU time = 0 ms, elapsed time = 0 ms. (10000 rows affected) Table 'Tabela'. Scan count 1, logical reads 556, physical reads 1, read-ahead reads 0, lob logical reads 0, lob physical reads 0, lob read-ahead reads 0. Table 'Sites_RSS'. Scan count 1, logical reads 33, physical reads 1, read-ahead reads 0, lob logical reads 0, lob physical reads 0, lob read-ahead reads 0. Table 'Historico_Deadlocks'. Scan count 1, logical reads 27, physical reads 2, read-ahead reads 0, lob logical reads 7923, lob physical reads 0, lob read-ahead reads 7279. Table 'Feriado_ES'. Scan count 1, logical reads 2, physical reads 1, read-ahead reads 0, lob logical reads 0, lob physical reads 0, lob read-ahead reads 0. Table 'Feriado'. Scan count 1, logical reads 1, physical reads 1, read-ahead reads 0, lob logical reads 0, lob physical reads 0, lob read-ahead reads 0. Table 'Fato_Venda'. Scan count 1, logical reads 1, physical reads 1, read-ahead reads 0, lob logical reads 0, lob physical reads 0, lob read-ahead reads 0. Table 'Dim_Forma_Pagamento'. Scan count 1, logical reads 1, physical reads 1, read-ahead reads 0, lob logical reads 0, lob physical reads 0, lob read-ahead reads 0. Table 'Enderecos'. Scan count 1, logical reads 2, physical reads 1, read-ahead reads 0, lob logical reads 0, lob physical reads 0, lob read-ahead reads 0. Table 'Dim_Produto'. Scan count 1, logical reads 1, physical reads 1, read-ahead reads 0, lob logical reads 0, lob physical reads 0, lob read-ahead reads 0. Table 'Dia_Util'. Scan count 1, logical reads 2, physical reads 2, read-ahead reads 0, lob logical reads 0, lob physical reads 0, lob read-ahead reads 0. Table 'Dim_Cliente'. Scan count 1, logical reads 1, physical reads 1, read-ahead reads 0, lob logical reads 0, lob physical reads 0, lob read-ahead reads 0. Table 'Conteudo_RSS'. Scan count 1, logical reads 1, physical reads 0, read-ahead reads 22, lob logical reads 0, lob physical reads 0, lob read-ahead reads 0. Table 'Clientes'. Scan count 1, logical reads 2, physical reads 1, read-ahead reads 0, lob logical reads 0, lob physical reads 0, lob read-ahead reads 0. SQL Server Execution Times: CPU time = 203 ms, elapsed time = 3486 ms. |
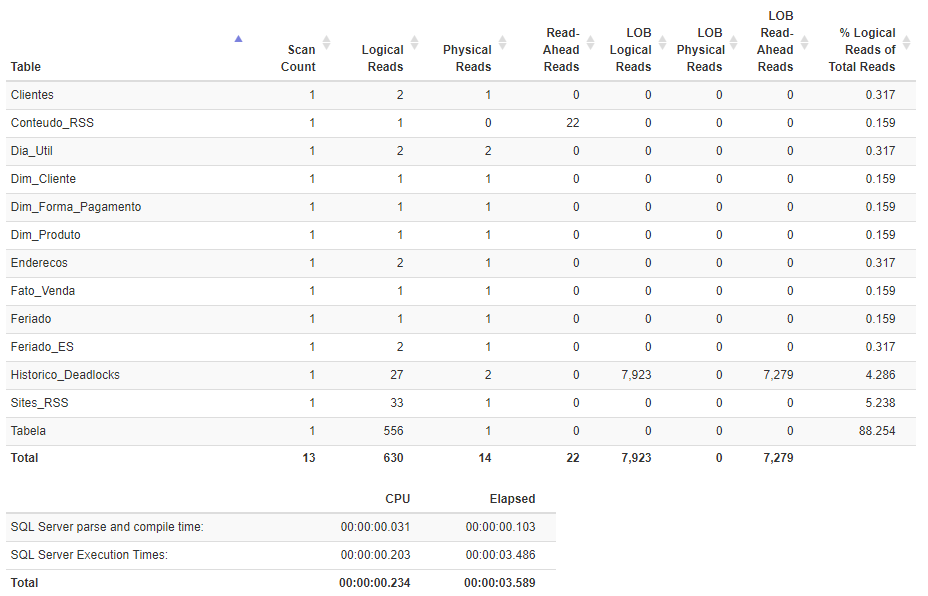
Saída utilizando a ferramenta Statistics Parser
Outras alternativas
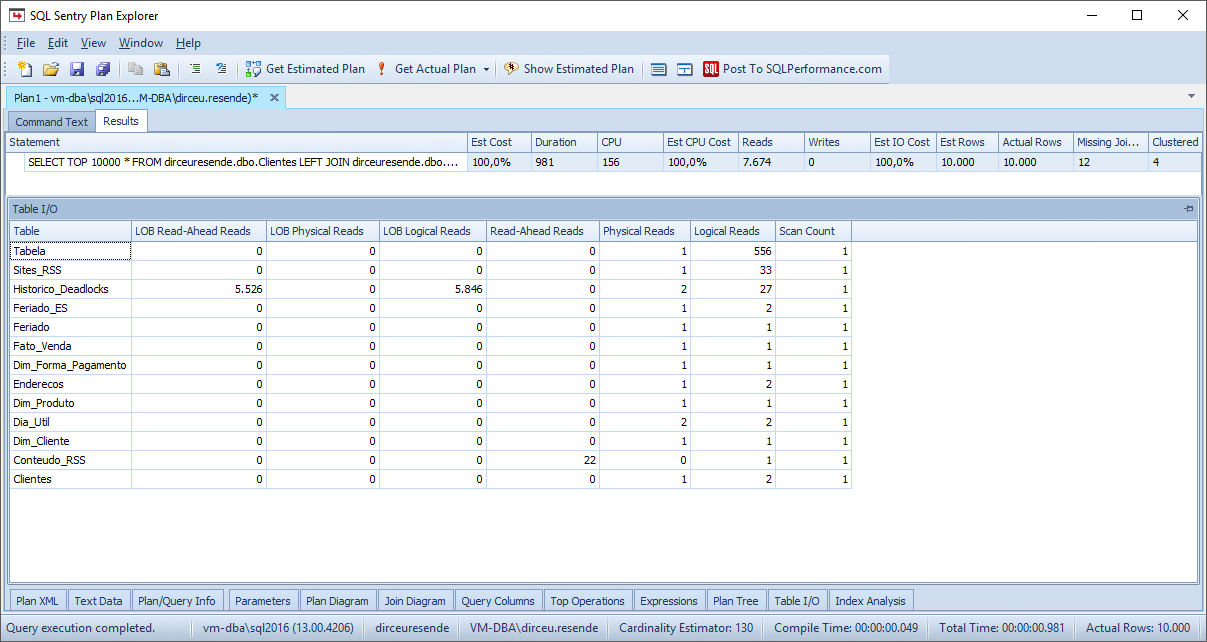
Caso você esteja buscando outras alternativas mais completas ao Statistics Parser, recomendo o SQLSentry Plan Explorer, uma ferramenta excelente e que pessoalmente gosto muito e utilizo sempre que preciso otimizar uma consulta (em breve farei um post só sobre ela)
Exemplo de uso
And that's it, folks!
Espero que tenham gostado desse post, um abraço e até a próxima!