Hey Guys!
O tema do post de hoje é timeout, que consiste em um tempo limite (geralmente, medido em segundos) em que uma operação irá aguardar até que ela encerre a execução de forma forçada, caso esse tempo limite seja atingido.
O objetivo desse post é mostrar como identificar timeout ou conexões interrompidas utilizando Extended Events (XE) ou SQL Profiler (Trace) e facilitar na análise desse tipo de problema tão comum no dia a dia.
Depois de identificar a causa raiz do timeout, a solução para resolver isso é tentar otimizar as consultas através de técnicas de Performance Tuning para fazer com que o tempo de execução seja reduzido. Dependendo do processo, se ele realmente for algo que envolva muito processamento e ele realmente é demorado, vale a pena aumentar o tempo de timeout desse processo em específico, mas isso é assunto para a minha série de Performance Tuning no SQL Server.
No SQL Server, temos vários tipos de timeout, onde eu gostaria de destacar:
- Remote Query Timeout (sp_configure), que define o tempo máximo que consultas remotas (utilizando linked server) podem ser executadas (tempo padrão: 600 segundos)
- lock_timeout (comando SET), que é o tempo que o client que está executando um comando SQL irá aguardar para que um lock seja liberado para continuar a execução desse comando (tempo padrão: -1 = infinito = vai aguardar indefinidamente)
- Command Timeout é uma propriedade de drivers de conexão a banco de dados, como ADO.NET, JDBC e outros, que permite definir um limite máximo de tempo que uma instrução SQL poderá executar no banco de dados. Esse valor pode ser alterado dinamicamente na aplicação, podendo ter tempos limites diferentes, dependendo do contexto. (tempo padrão: 30 segundos)
- Connection Timeout é uma propriedade da string de conexão que permite definir um limite de tempo máximo em que o driver de conexão irá aguardar para estabelecer uma conexão com o banco de dados (tempo padrão: 30 segundos)
É muito importante deixar claro que os timeouts de lock_timeout, Command Timeout e Connection Timeout são limites impostos pelo client/driver de conexão e não pelo banco de dados.
Quando um timeout ocorre, ele vai gerar uma exceção na aplicação, mas do ponto de vista do banco de dados, não houve nenhum erro ou problema na execução (ou conexão), justamente porque o timeout não ocorre no banco, ou seja, não é o banco que está interrompendo a instrução SQL e sim, a aplicação.
Caso você queira saber mais sobre os comandos SET do SQL Server, acesse o artigo Os comandos SET do SQL Server.
Recomendo também, a leitura do meu artigo Timeout ao executar Queries via Linked Server no SQL Server, caso esteja enfrentando algum problema relacionado à isso.
Não podemos nos esquecer também do timeout da ferramenta de desenvolvimento (IDE) que o DBA ou desenvolvedor usa pra acessar o banco de dados.
O SQL Server Management Studio (SSMS), por exemplo, possui uma propriedade chamada “Execution time-out”, que define quanto tempo o SSMS deve esperar para executar uma query (internamente, isso é a propriedade Command Timeout do driver de conexão).
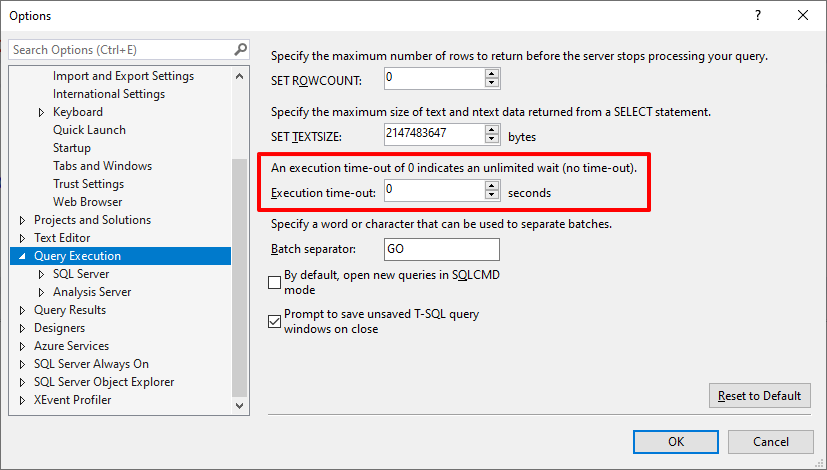
O valor padrão dessa propriedade no SSMS é 0 (infinito), ou seja, não possui limite de tempo.
Como gerar um timeout utilizando o SQLCMD
Para poder criar alguns registros de testes e demonstrar como identificar timeouts no banco de dados, vou forçar a ocorrência de timeouts no banco de dados.
Para isso, vou utilizar o utilitário SQLCMD e a propriedade -t 1 (query timeout de 1 segundo), e vou utilizar o comando WAITFOR DELAY ’00:00:05′, que fica 5 segundos aguardando, ou seja, sempre que eu executar esse comando, irei gerar um evento de timeout.
Resultado da execução:
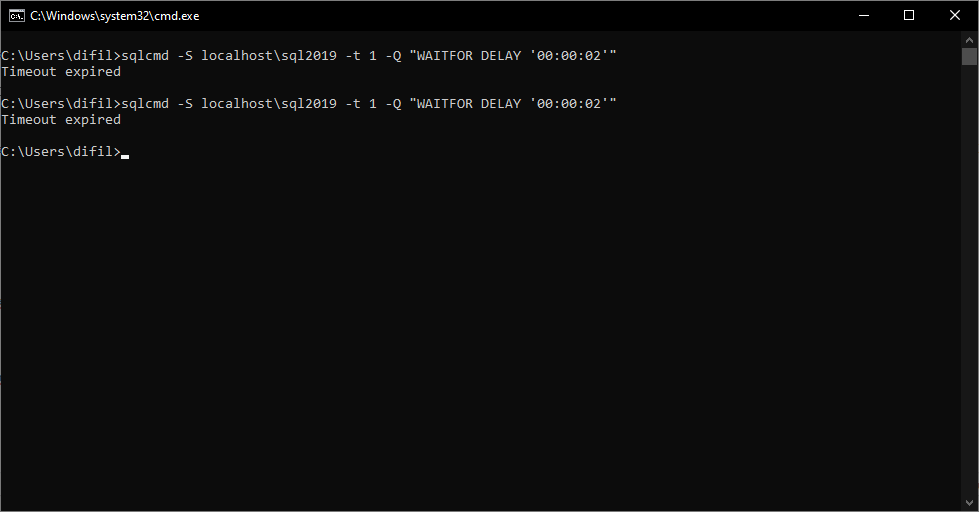
Timeouts gerados.
Como identificar timeouts no banco de dados utilizando Extended Events (XE)
Para identificar timeouts no banco de dados, eu já vi muitas pessoas utilizando o tempo de execução da query para definir se houve um timeout ou não. Como o padrão são 30 segundos, a pessoa supõe que se a query demorou exatos 30 segundos, é porque ocorreu um timeout. Entretanto, nem sempre isso é verdade, até porque, como eu já mencionei no começo do post, para cada contexto ou tela do sistema, o desenvolvedor pode definir tempos de timeout diferentes.
Uma das formas de se conseguir identificar se realmente ocorreu um timeout, é utilizando o Extended Events (XE), analisando a classe de evento attention, disponível desde o SQL Server 2012, que indica que ocorreu um evento que requer atenção, como cancelamentos, solicitações de interrupção de cliente e perda de conexões com clientes. Operações de cancelamento também podem ser vistas como parte da implementação de tempos limite de acesso a dados do driver (timeouts)
Vou compartilhar o script já pronto para implementar o monitoramento e também prints da interface do Extended Events, caso você queira criar por contra própria, via tela.
Script para monitorar timeout no SQL Server utilizando Extended Events (XE)
|
1 2 3 4 5 6 7 8 9 10 11 12 13 14 15 16 17 18 19 20 21 22 23 24 25 26 27 28 29 30 31 32 33 34 35 36 37 38 |
-- Apaga a sessão, caso ela já exista IF ((SELECT COUNT(*) FROM sys.server_event_sessions WHERE [name] = 'Monitora Timeouts') > 0) DROP EVENT SESSION [Monitora Timeouts] ON SERVER GO CREATE EVENT SESSION [Monitora Timeouts] ON SERVER ADD EVENT sqlserver.attention ( ACTION ( sqlserver.client_app_name, sqlserver.client_hostname, sqlserver.[database_name], sqlserver.nt_username, sqlserver.num_response_rows, sqlserver.server_instance_name, sqlserver.server_principal_name, sqlserver.server_principal_sid, sqlserver.session_id, sqlserver.session_nt_username, sqlserver.session_server_principal_name, sqlserver.sql_text, sqlserver.username ) ) ADD TARGET package0.event_file ( SET filename = N'D:\SQL\Traces\Monitora_Timeout.xel', -- Não esqueça de mudar o caminho aqui :) max_file_size = ( 50 ), -- Tamanho máximo (MB) de cada arquivo max_rollover_files = ( 8 ) -- Quantidade de arquivos gerados ) WITH ( STARTUP_STATE = OFF ) -- Ativando a sessão (por padrão, ela é criada desativada) ALTER EVENT SESSION [Monitora Timeouts] ON SERVER STATE = START GO |
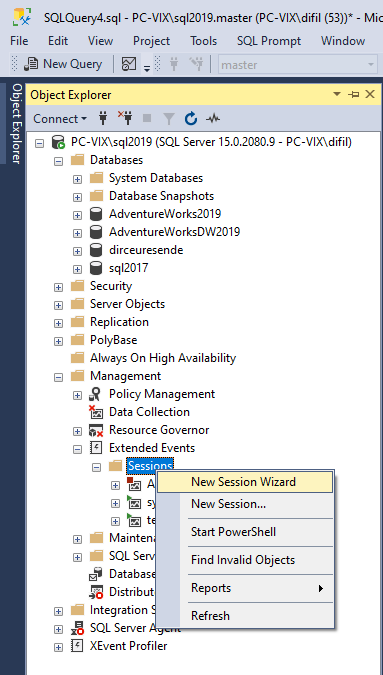
Interface para monitorar timeout no SQL Server utilizando Extended Events (XE)
Clique para visualizar os screenshots
Screenshot 1 – Abrir o Wizard do XE pelo Object Explorer do SSMS
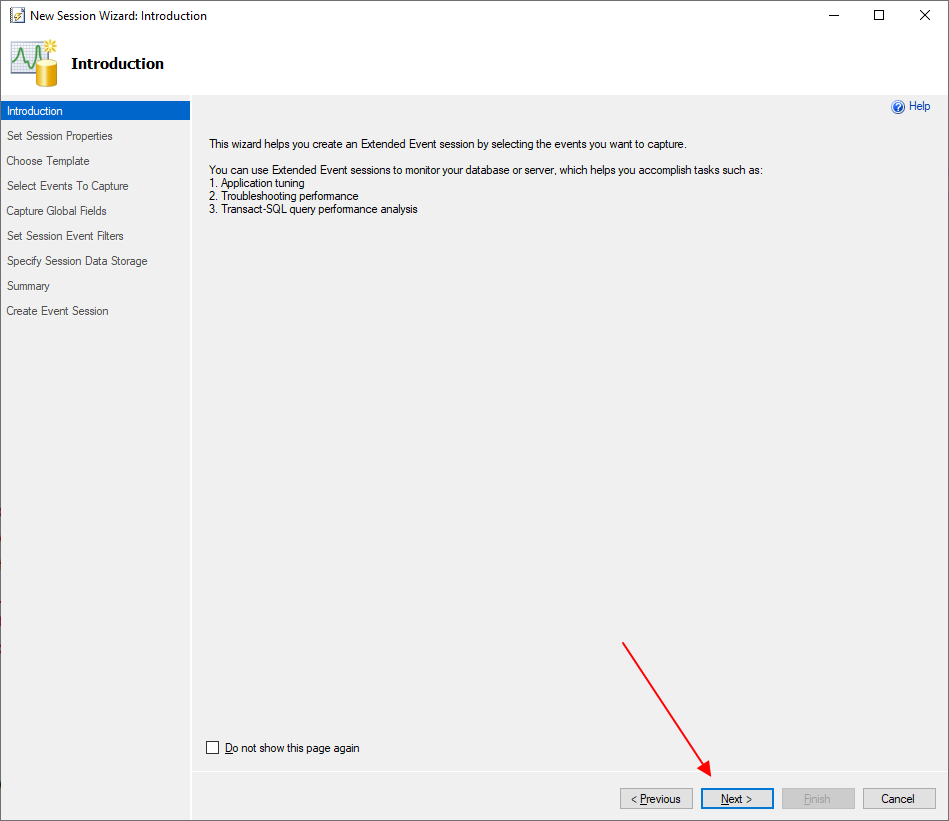
Screenshot 2 – Tela inicial
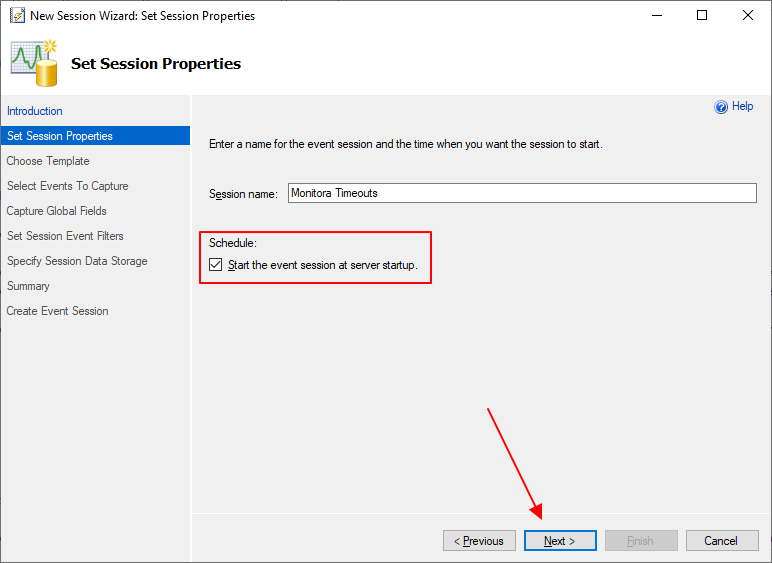
Screenshot 3 – Definir o nome do Extended Event e marcar o checkbox para habilitar o evento ao final da configuração
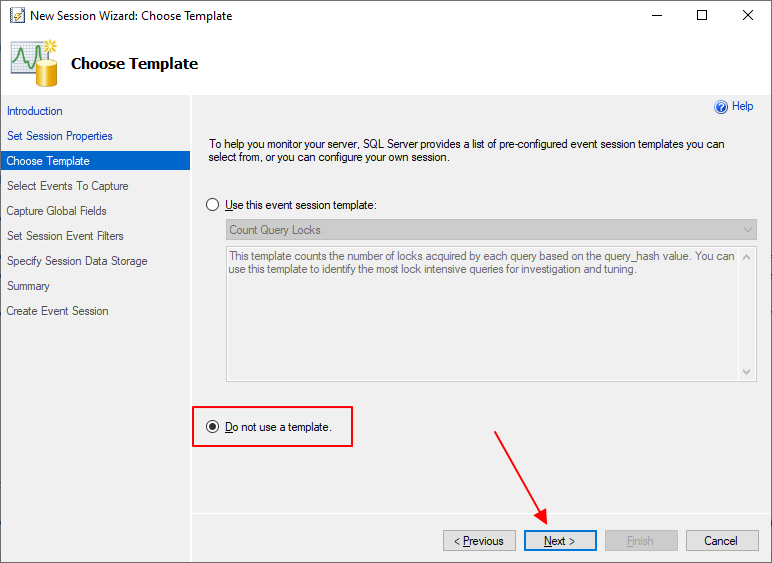
Screenshot 4 – Marcar que não quero usar nenhum template
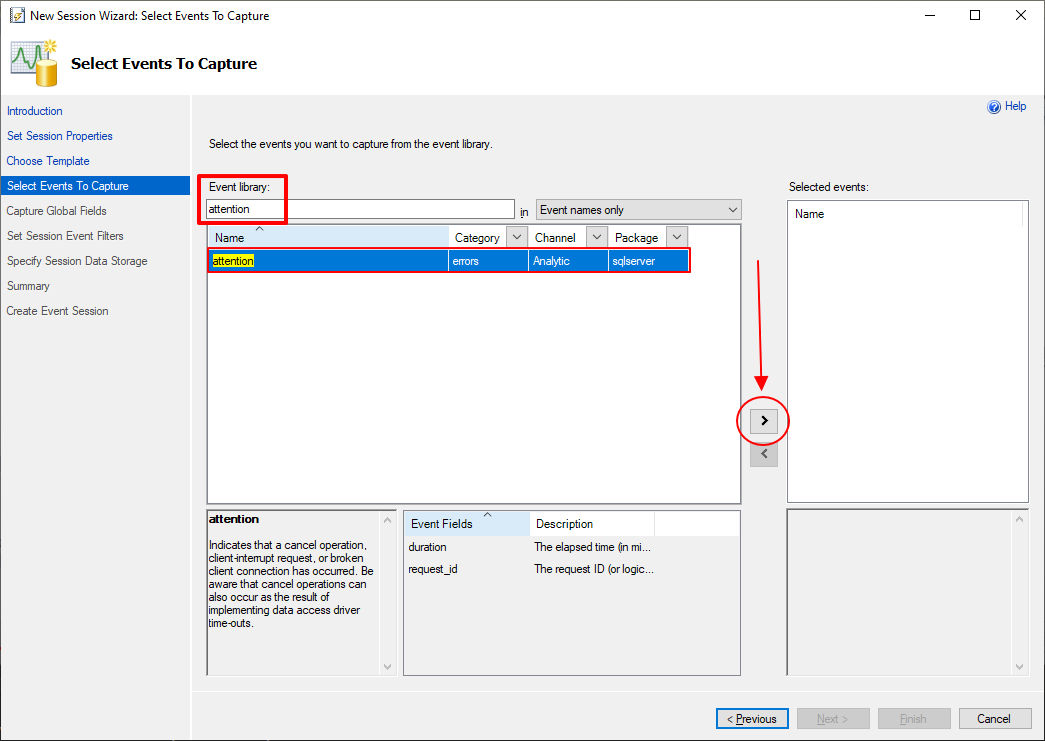
Screenshot 5 – Selecionar o evento “attention” e adicionar na lista de eventos selecionados
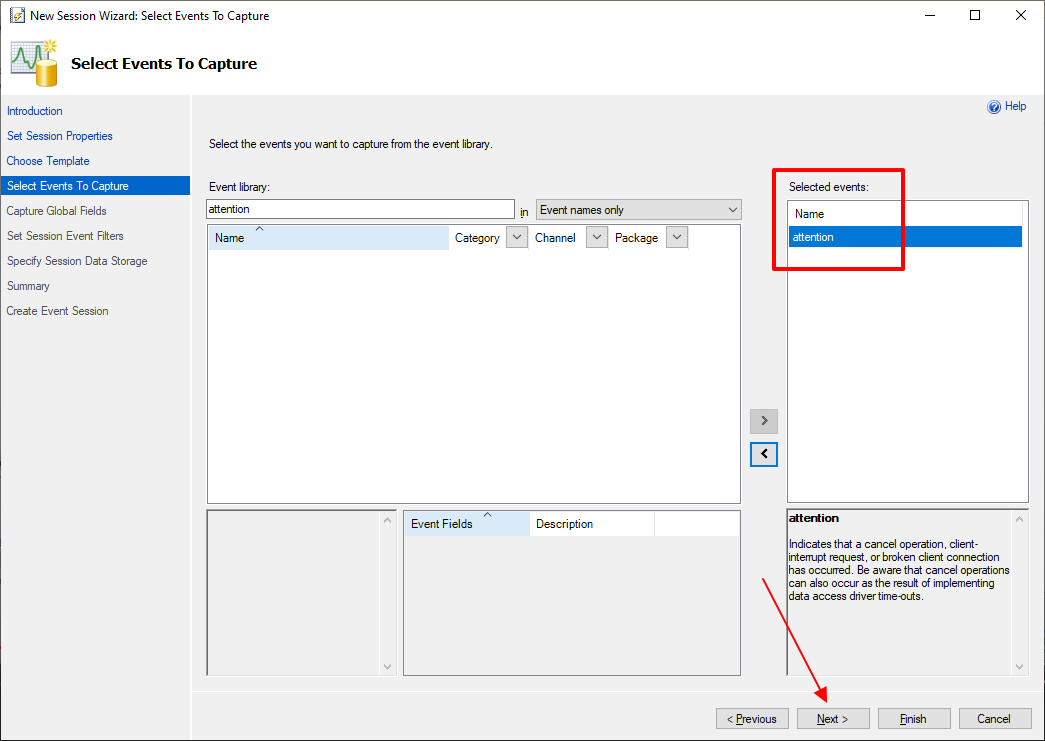
Screenshot 6 – Confirmar a seleção e avançar para próxima tela
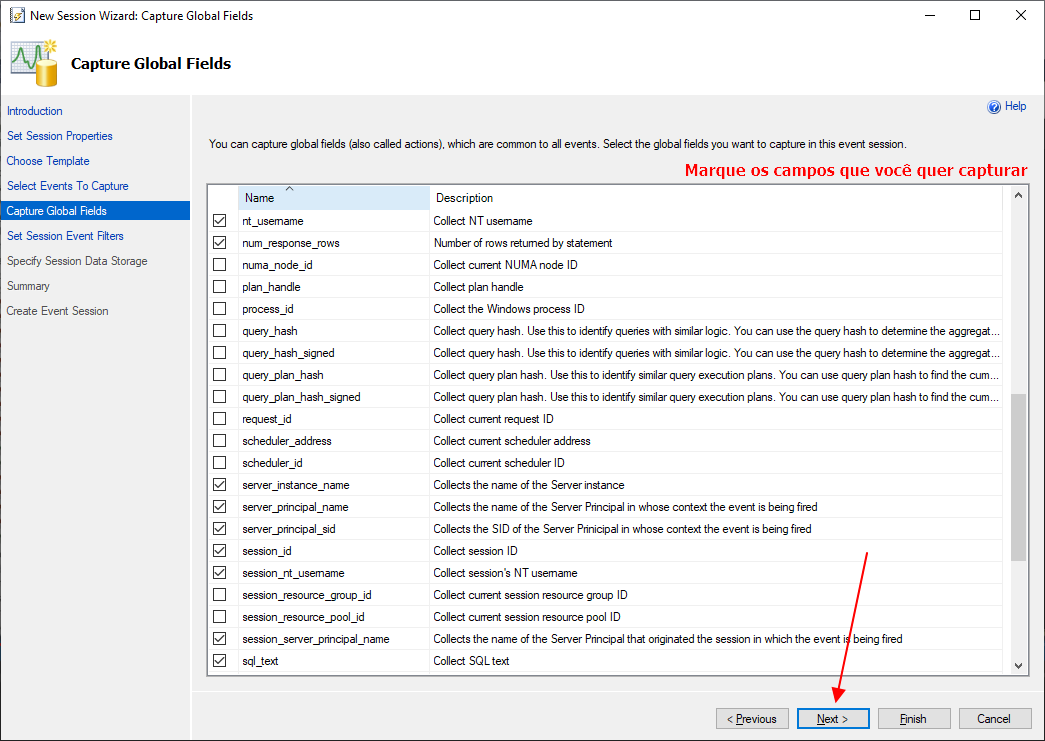
Screenshot 7 – Selecionar os campos de retorno que você quer que o evento retorne
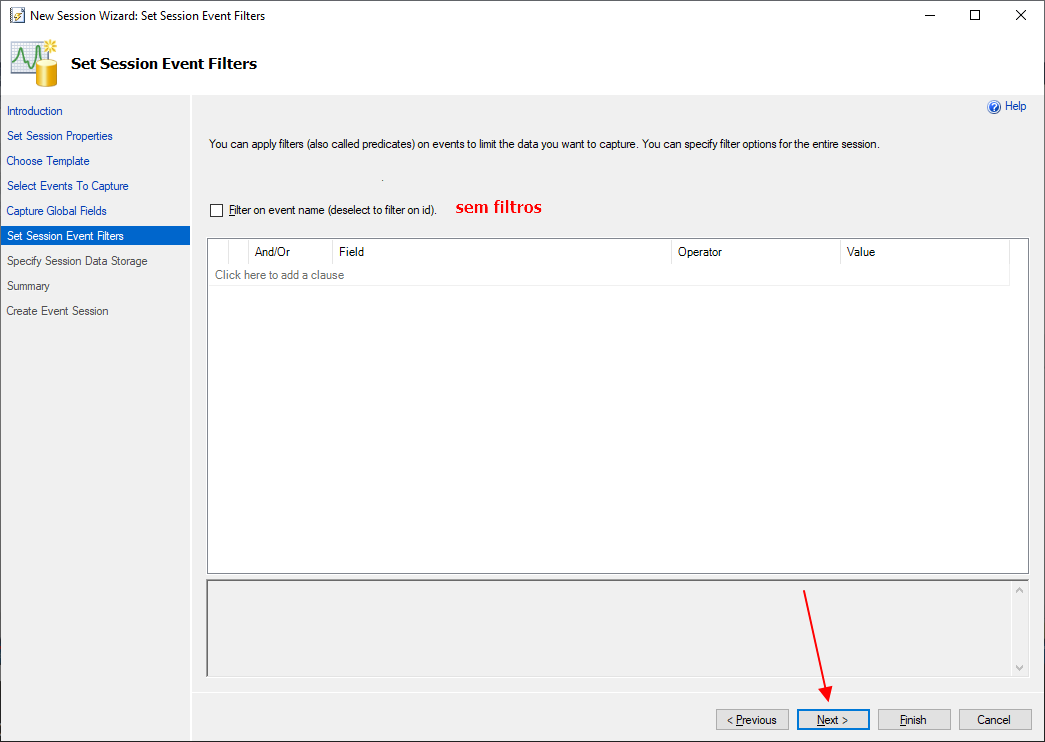
Screenshot 8 – Avançar sem aplicar filtros
Screenshot 9 – Definir o local para salvar o arquivo .xel, tamanho máximo e rollover dos arquivos

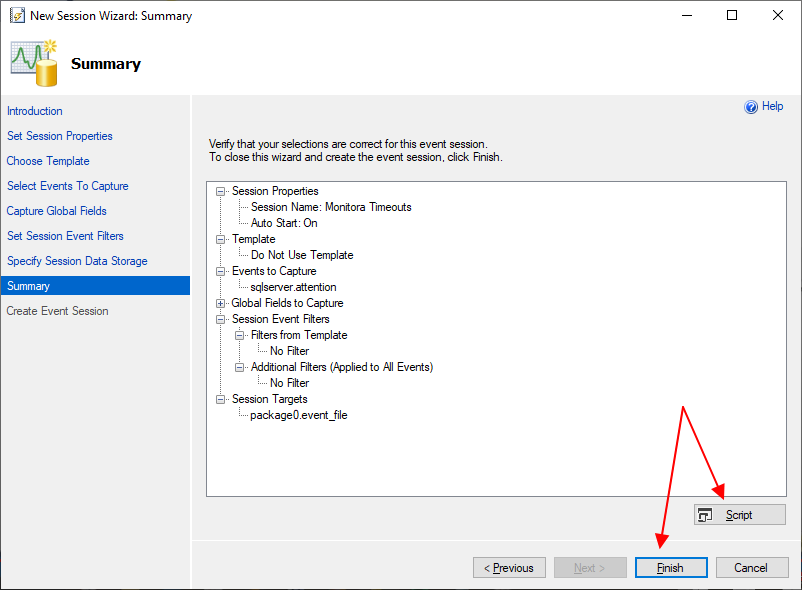
Screenshot 10 – Tela final e resumo das operações
Script para ler os dados gravados pelo Extended Event (XE)
Clique para visualizar o script
|
1 2 3 4 5 6 7 8 9 10 11 12 13 14 15 16 17 18 19 20 21 22 23 24 25 26 27 28 29 30 31 32 33 34 35 36 37 38 39 40 41 42 43 44 45 46 47 48 49 50 51 52 53 54 55 56 57 |
IF (OBJECT_ID('dbo.Historico_Timeout') IS NULL) BEGIN -- DROP TABLE dbo.Historico_Timeout CREATE TABLE dbo.Historico_Timeout ( [Dt_Evento] DATETIME, [session_id] INT, [duration] BIGINT, [server_instance_name] VARCHAR(100), [database_name] VARCHAR(100), [session_nt_username] VARCHAR(100), [nt_username] VARCHAR(100), [client_hostname] VARCHAR(100), [client_app_name] VARCHAR(100), [num_response_rows] INT, [sql_text] XML ) WITH(DATA_COMPRESSION=PAGE) END DECLARE @TimeZone INT = DATEDIFF(HOUR, GETUTCDATE(), GETDATE()) DECLARE @Dt_Ultimo_Evento DATETIME = ISNULL((SELECT MAX(Dt_Evento) FROM dbo.Historico_Timeout WITH(NOLOCK)), '1990-01-01') IF (OBJECT_ID('tempdb..#Eventos') IS NOT NULL) DROP TABLE #Eventos ;WITH CTE AS ( SELECT CONVERT(XML, event_data) AS event_data FROM sys.fn_xe_file_target_read_file(N'D:\SQL\Traces\Monitora_Timeout*.xel', NULL, NULL, NULL) ) SELECT DATEADD(HOUR, @TimeZone, CTE.event_data.value('(//event/@timestamp)[1]', 'datetime')) AS Dt_Evento, CTE.event_data INTO #Eventos FROM CTE WHERE DATEADD(HOUR, @TimeZone, CTE.event_data.value('(//event/@timestamp)[1]', 'datetime')) > @Dt_Ultimo_Evento INSERT INTO dbo.Historico_Timeout SELECT A.Dt_Evento, xed.event_data.value('(action[@name="session_id"]/value)[1]', 'int') AS [session_id], xed.event_data.value('(data[@name="duration"]/value)[1]', 'bigint') AS [duration], xed.event_data.value('(action[@name="server_instance_name"]/value)[1]', 'varchar(100)') AS [server_instance_name], xed.event_data.value('(action[@name="database_name"]/value)[1]', 'varchar(100)') AS [database_name], xed.event_data.value('(action[@name="session_nt_username"]/value)[1]', 'varchar(100)') AS [session_nt_username], xed.event_data.value('(action[@name="nt_username"]/value)[1]', 'varchar(100)') AS [nt_username], xed.event_data.value('(action[@name="client_hostname"]/value)[1]', 'varchar(100)') AS [client_hostname], xed.event_data.value('(action[@name="client_app_name"]/value)[1]', 'varchar(100)') AS [client_app_name], xed.event_data.value('(action[@name="num_response_rows"]/value)[1]', 'int') AS [num_response_rows], TRY_CAST(xed.event_data.value('(action[@name="sql_text"]/value)[1]', 'varchar(max)') AS XML) AS [sql_text] FROM #Eventos A CROSS APPLY A.event_data.nodes('//event') AS xed (event_data) |
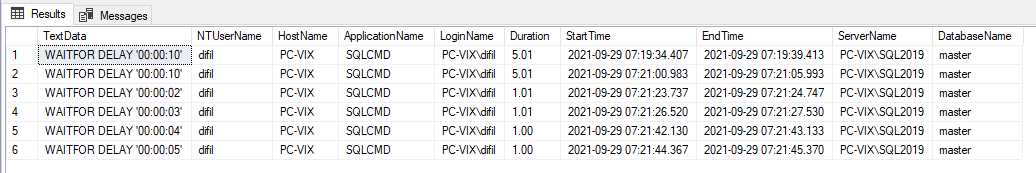
Exemplo de dados retornados:

- SQL Server – Como identificar recursos descontinuados (deprecated features) sendo utilizados na instância (Extended Events – XE)
- SQL Server – Como gerar um histórico de deadlocks para análise de falhas em rotinas
- SQL Server – Como criar um monitoramento de erros e exceções no seu banco de dados utilizando Extended Events (XE)
- SQL Server – Como identificar e coletar informações de consultas demoradas utilizando Extended Events (XE)
Como identificar timeouts no banco de dados utilizando SQL Profiler (Trace)
Uma outra forma de identificar timeouts no banco de dados é utilizando o SQL Profiler (Trace), especialmente se você está utilizando uma versão anterior à 2012, que não possui suporte ao evento attention do Extended Events.
Para atingir esse objetivo com o SQL Profiler, vamos monitorar os eventos RPC:Completed, SP:StmtCompleted e SQL:BatchCompleted e filtrar apenas os resultados que atendam ao filtro Error = 2.
Mesmo aplicando esse filtro, você deve acompanhar de perto se o workload do seu servidor vai aumentar muito após ativar esse trace, porque tudo o que for executado, será analisado por esse trace.
Sempre que possível, tente utilizar Extended Events (XE) ao invés de Profiler (Trace), especialmente para essa situação.
Script para monitorar timeout no SQL Server utilizando SQL Profiler (Trace)
|
1 2 3 4 5 6 7 8 9 10 11 12 13 14 15 16 17 18 19 20 21 22 23 24 25 26 27 28 29 30 31 32 33 34 35 36 37 38 39 40 41 42 43 44 45 46 47 48 49 50 51 52 53 54 55 56 57 58 59 60 61 62 63 64 65 66 67 68 69 70 71 72 73 74 75 76 77 78 79 80 81 82 83 84 85 86 87 88 89 90 91 92 93 94 95 96 97 98 99 100 101 102 103 104 105 106 107 108 109 110 111 112 113 114 115 116 117 118 119 120 121 122 123 124 125 126 127 128 129 130 131 132 133 134 135 136 137 138 139 140 141 142 143 144 145 146 147 148 149 150 151 152 153 154 155 156 157 158 159 160 161 162 163 164 165 166 167 168 169 170 171 172 173 174 175 176 177 178 179 180 181 182 183 184 185 186 187 188 189 190 191 |
-------------------------------------------------------- -- Armazena os resultados do Trace na tabela -------------------------------------------------------- DECLARE @Trace_Id INT, @Path VARCHAR(MAX) SELECT @Trace_Id = id, @Path = [path] FROM sys.traces WHERE [path] LIKE '%Monitora_Timeout.trc' IF (@Trace_Id IS NOT NULL) BEGIN -- Interrompe o rastreamento especificado. EXEC sys.sp_trace_setstatus @Trace_Id = @Trace_Id, @status = 0 -- Fecha o rastreamento especificado e exclui sua definição do servidor. EXEC sys.sp_trace_setstatus @Trace_Id = @Trace_Id, @status = 2 IF (OBJECT_ID('dbo.Historico_Timeout') IS NULL) BEGIN -- DROP TABLE dbo.Historico_Timeout CREATE TABLE [dbo].[Historico_Timeout] ( [TextData] VARCHAR(MAX), [NTUserName] NVARCHAR(256), [HostName] NVARCHAR(256), [ApplicationName] NVARCHAR(256), [LoginName] NVARCHAR(256), [Duration] DECIMAL(15, 2), [StartTime] DATETIME, [EndTime] DATETIME, [ServerName] NVARCHAR(256), [DatabaseName] NVARCHAR(256) ) WITH ( DATA_COMPRESSION = PAGE ) CREATE CLUSTERED INDEX [SK01_Traces] ON [dbo].[Historico_Timeout] ([StartTime]) WITH (FILLFACTOR=80, STATISTICS_NORECOMPUTE=ON, DATA_COMPRESSION = PAGE) END INSERT INTO dbo.Historico_Timeout ( TextData, NTUserName, HostName, ApplicationName, LoginName, Duration, StartTime, EndTime, ServerName, DatabaseName ) SELECT TextData, NTUserName, HostName, ApplicationName, LoginName, CAST(Duration / 1000 / 1000.00 AS NUMERIC(15, 2)) Duration, StartTime, DATEADD(MILLISECOND, Duration / 1000, StartTime) AS EndTime, ServerName, DatabaseName FROM ::fn_trace_gettable(@Path, DEFAULT) WHERE ApplicationName NOT LIKE '%Management Studio%' AND Error = 2 -- Abort ORDER BY StartTime -------------------------------------------------------- -- Apaga o arquivo de trace -------------------------------------------------------- DECLARE @Fl_Xp_CmdShell_Ativado BIT = (SELECT (CASE WHEN CAST([value] AS VARCHAR(MAX)) = '1' THEN 1 ELSE 0 END) FROM sys.configurations WHERE [name] = 'xp_cmdshell') IF (@Fl_Xp_CmdShell_Ativado = 0) BEGIN EXECUTE sp_configure 'show advanced options', 1; RECONFIGURE WITH OVERRIDE; EXEC sp_configure 'xp_cmdshell', 1; RECONFIGURE WITH OVERRIDE; END DECLARE @Cmd VARCHAR(4000) = 'del ' + @Path + ' /Q' EXEC sys.xp_cmdshell @Cmd IF (@Fl_Xp_CmdShell_Ativado = 0) BEGIN EXEC sp_configure 'xp_cmdshell', 0; RECONFIGURE WITH OVERRIDE; EXECUTE sp_configure 'show advanced options', 0; RECONFIGURE WITH OVERRIDE; END END -------------------------------------------------------- -- Ativa o trace novamenmte -------------------------------------------------------- DECLARE @rc INT, @TraceID INT, @maxfilesize BIGINT = 50, @on BIT = 1 EXEC @rc = sp_trace_create @TraceID OUTPUT, 0, N'D:\SQL\Traces\Monitora_Timeout', @maxfilesize, NULL IF (@rc = 0) BEGIN exec sp_trace_setevent @TraceID, 10, 1, @on exec sp_trace_setevent @TraceID, 10, 10, @on exec sp_trace_setevent @TraceID, 10, 3, @on exec sp_trace_setevent @TraceID, 10, 6, @on exec sp_trace_setevent @TraceID, 10, 8, @on exec sp_trace_setevent @TraceID, 10, 11, @on exec sp_trace_setevent @TraceID, 10, 12, @on exec sp_trace_setevent @TraceID, 10, 13, @on exec sp_trace_setevent @TraceID, 10, 14, @on exec sp_trace_setevent @TraceID, 10, 31, @on exec sp_trace_setevent @TraceID, 10, 34, @on exec sp_trace_setevent @TraceID, 10, 35, @on exec sp_trace_setevent @TraceID, 10, 60, @on exec sp_trace_setevent @TraceID, 45, 1, @on exec sp_trace_setevent @TraceID, 45, 3, @on exec sp_trace_setevent @TraceID, 45, 6, @on exec sp_trace_setevent @TraceID, 45, 8, @on exec sp_trace_setevent @TraceID, 45, 10, @on exec sp_trace_setevent @TraceID, 45, 11, @on exec sp_trace_setevent @TraceID, 45, 12, @on exec sp_trace_setevent @TraceID, 45, 13, @on exec sp_trace_setevent @TraceID, 45, 14, @on exec sp_trace_setevent @TraceID, 45, 28, @on exec sp_trace_setevent @TraceID, 45, 34, @on exec sp_trace_setevent @TraceID, 45, 35, @on exec sp_trace_setevent @TraceID, 45, 60, @on exec sp_trace_setevent @TraceID, 12, 1, @on exec sp_trace_setevent @TraceID, 12, 3, @on exec sp_trace_setevent @TraceID, 12, 11, @on exec sp_trace_setevent @TraceID, 12, 6, @on exec sp_trace_setevent @TraceID, 12, 8, @on exec sp_trace_setevent @TraceID, 12, 10, @on exec sp_trace_setevent @TraceID, 12, 12, @on exec sp_trace_setevent @TraceID, 12, 13, @on exec sp_trace_setevent @TraceID, 12, 14, @on exec sp_trace_setevent @TraceID, 12, 31, @on exec sp_trace_setevent @TraceID, 12, 35, @on exec sp_trace_setevent @TraceID, 12, 60, @on -- Inclui os filtros declare @intfilter int declare @bigintfilter bigint set @intfilter = 2 exec sp_trace_setfilter @TraceID, 31, 0, 0, @intfilter set @intfilter = NULL exec sp_trace_setfilter @TraceID, 31, 0, 1, @intfilter -- Ativa o trace exec sp_trace_setstatus @TraceID, 1 END |
Interface para monitorar timeout no SQL Server utilizando SQL Profiler (Trace)
Clique para visualizar os screenshots
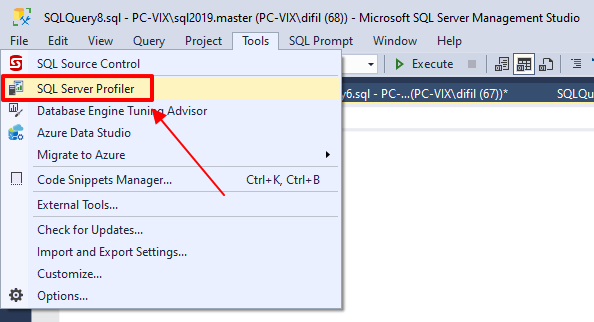
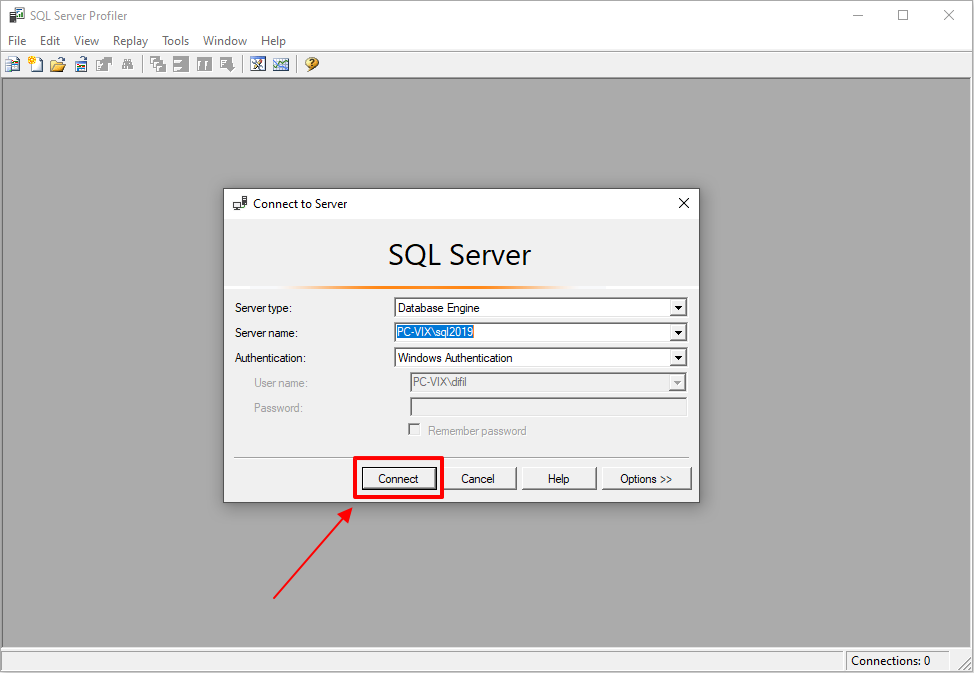
Screenshot 1 – Abrindo o SQL Profiler
Screenshot 2 – Conectando na base de dados
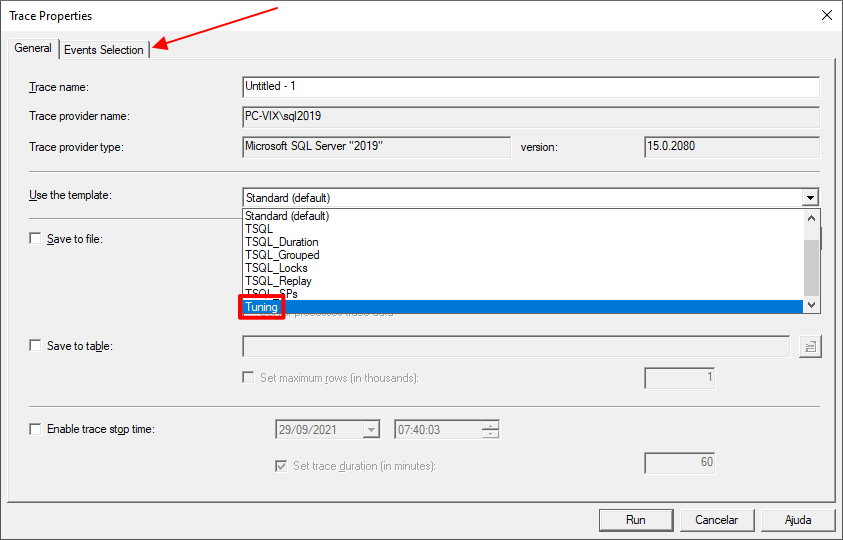
Screenshot 3 – Selecionar o template Tuning e clicar na aba “Event Selection”
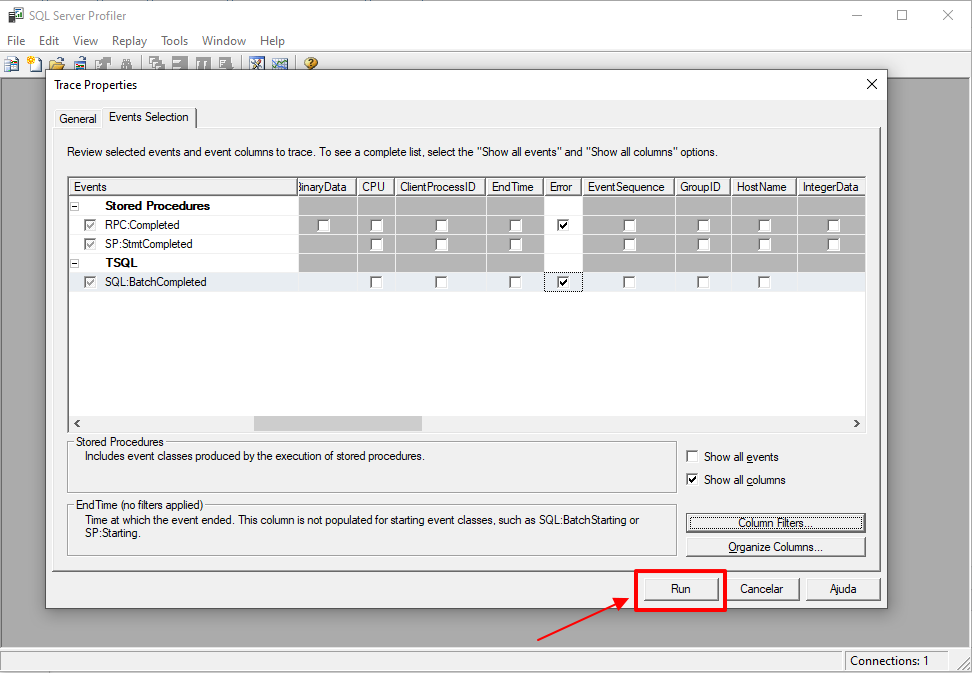
Screenshot 4 – Marcar o checkbox “Show all columns”, marcar a coluna “Error” (e as outras que você queira retornar) e clicar no botão “Column Filters”

Screenshot 5 – Aplicar um filtro na coluna Error e usar a medida Error = 2. Marcar o checkbox “Exclude rows that do not contain values”

Screenshot 6 – Clicar no botão de Run para iniciar o trace no servidor
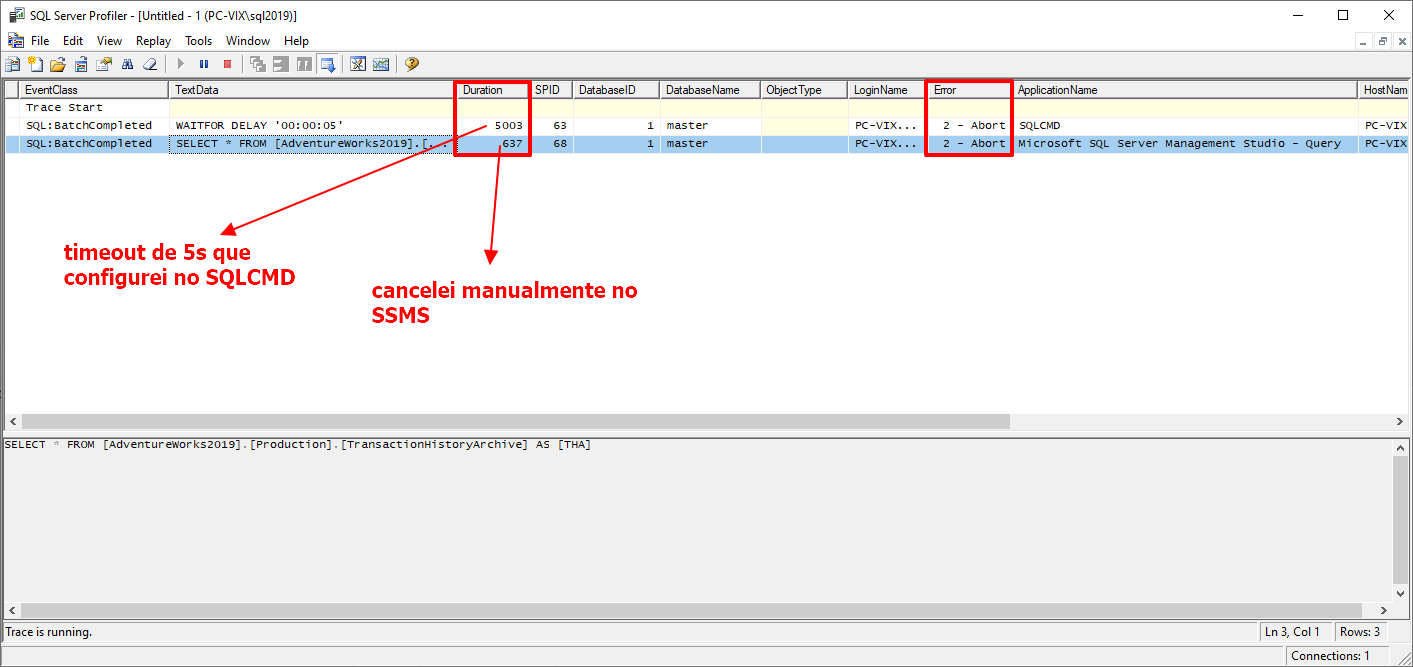
Screenshot 7 – Analisar os resultados encontrados
Screenshot 8 – Resultados coletados e já armazenados numa tabela de histórico
- SQL Server – Como identificar e coletar informações de consultas demoradas utilizando Trace (SQL Server Profiler)
- SQL Server – Como auditar erros de permissão em objetos utilizando o SQL Profiler (Trace)
- Using the standard SQL Server trace to audit events (fn_trace_gettable)
- Monitoring DDL and DCL operations using SQL Server's fn_trace_gettable
Trecho de uma live onde o Márcio Júnior demonstra como identificar timeout no SQL Server
And that's it, folks!
Um grande abraço e até mais.