Hey Guys!
Como vocês estão ?
Neste post vou demonstrar como criar seu primeiro cubo multidimensional no modelo estrela (Star schema). Esse post acabou sendo feito sem a idealização que costumo fazer, pois estava escrevendo outro post para o blog e precisei criar um cubo simples no Analysis Services para a demonstração e entendi como uma oportunidade de falar um pouco sobre BI também, assunto que trabalho no meu dia a dia e realmente, quase não escrevo sobre. Resolvi então, criar esse post demonstrando o passo-a-passo para a criação desse cubo.
Alguns conceitos de BI
Modelagem multidimensional
A modelagem multidimensional, ou dimensional como às vezes é chamada, é a técnica de modelagem de banco de dados para o auxílio às consultas do Data Warehouse nas mais diferentes perspectivas. A visão multidimensional permite o uso mais intuitivo para o processamento analítico pelas ferramentas OLAP (On-line Analytical Processing).
Toda modelagem dimensional possuem dois elementos imprescindíveis: as tabelas Fatos e as tabelas Dimensões. Ambas são obrigatórias e possuem característica complementares dentro de um Data Warehouse.
OLAP (On-line Analytical Processing)
O OLAP possui um conjunto de técnicas para o tratamento dos dados contidos na visão multidimensional do Data Warehouse. As ferramentas OLAP podem ser de diferentes tipos: MOLAP, ROLAP ou HOLAP.
O OLAP multidimensional (MOLAP) é o tipo de ferramenta que utiliza estrutura de banco de dados multidimensional. O OLAP relacional (ROLAP) utiliza a arquitetura relacional dos dados, onde o banco de dados possui a estrutura tradicional. Já o OLAP híbrido (HOLAP) é a junção das duas anteriores, utilizando os melhores aspectos e recursos de cada um dos dois tipos.
Dimensões
As Dimensões são os descritores dos dados oriundos da Fato. Possui o caráter qualitativo da informação e relacionamento de “um para muitos” com a tabela Fato. É a Dimensão que permite a visualização das informações por diversos aspectos e perspectivas. Ex: Cadastro de clientes, cadastro de formas de pagamento, etc.
Medidas
As medidas são valores numéricos que representam a Fato e a performance de um indicador de negócio associado às dimensões. Ex: Valor da venda, Quantidade de vendas, Ticket médio, etc.
Fatos
As Fatos contém as métricas. Possui o caráter quantitativo das informações descritivas armazenadas nas Dimensões. É onde estão armazenadas as ocorrências do negócio e possui relacionamento de “muitos para um” com as tabelas periféricas (Dimensão). É uma tabela que possui apenas as medidas e os ID’s que se ligam às dimensões para exibir as informações completas referente aos dados que serão visualizados.
Modelos da modelagem multidimensional
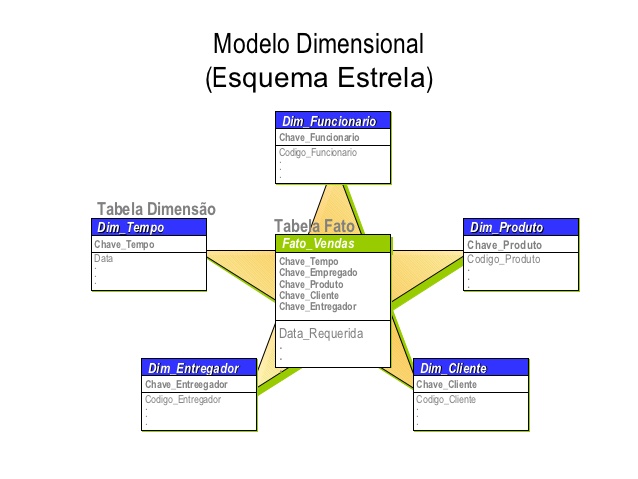
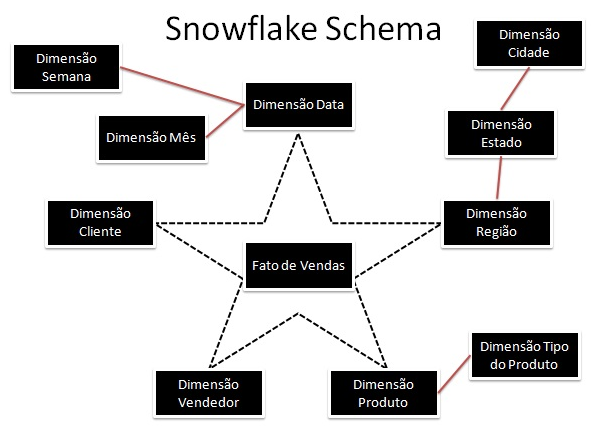
A modelagem dimensional possui dois modelos: o modelo estrela (star schema) e o modelo floco de neve (snow flake). Cada um com aplicabilidade diferente a depender da especificidade do problema.
As Dimensões do modelo estrela são desnormalizados, ao contrário do snow flake, que parcialmente possui normalização. A estrutura relacional diferencia-se da estrutura multidimensional principalmente devido a normalização, pouca redundância e a frequência de atualizações suportadas. A estrutura multidimensional possui, normalmente, desnormalização de tabelas, alta redundância e suporta periodicidade de atualizações de dados muito menor do que uma estrutura relacional convencional.
Modelo estrela:
Modelo floco de neve:
Gerando as dimensões e Fatos (ETL)
Nesta parte da criação do cubo, vou gerar as dimensões e Fatos com dados aleatórios. Claro que esses dados são utilizados apenas para demonstração. Num cenário real, não se deve utilizar dados aleatórios em análises de BI para criação de cubos multidimensionais, pois a análise não teria um valor real.
Para a geração aleatória das datas utilizei a função fncRand(), disponível no post SQL Server – Msg 443 Invalid use of a side-effecting operator ‘rand’ within a function.
|
1 2 3 4 5 6 7 8 9 10 11 12 13 14 15 16 17 18 19 20 21 22 23 24 25 26 27 28 29 30 31 32 33 34 35 36 37 38 39 40 41 42 43 44 45 46 47 48 49 50 51 52 53 54 55 56 57 58 59 60 61 62 63 64 65 66 67 68 69 70 71 72 73 74 75 76 77 78 79 80 81 82 83 84 85 86 87 88 89 90 91 92 93 94 95 96 97 98 99 100 101 102 103 104 |
------------------------------------------------------------------------ -- CRIAÇÃO DAS DIMENSÕES ------------------------------------------------------------------------ IF (OBJECT_ID('dbo.Dim_Cliente') IS NOT NULL) DROP TABLE dbo.Dim_Cliente CREATE TABLE dbo.Dim_Cliente ( Codigo INT IDENTITY(1, 1), Ds_Nome VARCHAR(100), Dt_Nascimento DATETIME, Sg_Sexo VARCHAR(20), Sg_UF VARCHAR(2), ) INSERT INTO dbo.Dim_Cliente VALUES ('Dirceu Resende', '1987-05-28', 'Masculino', 'RJ'), ('Cliente 1', '1971-01-15', 'Feminino', 'ES'), ('Cliente 2', '1955-02-05', 'Masculino', 'ES'), ('Cliente 3', '1997-08-07', 'Masculino', 'RJ'), ('Cliente 4', '2001-11-14', 'Masculino', 'MG'), ('Cliente 5', '1985-12-13', 'Masculino', 'SP'), ('Cliente 6', '1982-09-22', 'Masculino', 'ES') IF (OBJECT_ID('dbo.Dim_Forma_Pagamento') IS NOT NULL) DROP TABLE dbo.Dim_Forma_Pagamento CREATE TABLE dbo.Dim_Forma_Pagamento ( Codigo INT IDENTITY(1, 1), Ds_Nome VARCHAR(100) ) INSERT INTO dbo.Dim_Forma_Pagamento VALUES ('Dinheiro'), ('Cheque'), ('Boleto'), ('Cartão de Crédito') IF (OBJECT_ID('dbo.Dim_Produto') IS NOT NULL) DROP TABLE dbo.Dim_Produto CREATE TABLE dbo.Dim_Produto ( Codigo INT IDENTITY(1, 1), Ds_Nome VARCHAR(100), Peso INT, Categoria VARCHAR(50), Preco FLOAT ) INSERT INTO dbo.Dim_Produto VALUES ('Toalha', 25, 'Cama, Mesa e Banho', 19.99), ('TV 55', 3200, 'Eletro', 3500), ('TV 42', 2500, 'Eletro', 2359.70), ('Celular Top Android Novo', 120, 'Celulares', 1890), ('Celular Top iOS Usado', 114, 'Celulares', 4999.99), ('Cama Box', 7510, 'Cama, Mesa e Banho', 1249.99), ('Toalha de Rosto', 15, 'Cama, Mesa e Banho', 12.99), ('Prato', 250, 'Cozinha', 34.80), ('Talher', 25, 'Cozinha', 22.50), ('Panela', 250, 'Cozinha', 69.80), ('Microondas', 1450, 'Eletro', 369.99), ('Encosto de Mesa', 35, 'Cama, Mesa e Banho', 15.50) ------------------------------------------------------------------------ -- CRIAÇÃO DA FATO ------------------------------------------------------------------------ IF (OBJECT_ID('dbo.Fato_Venda') IS NOT NULL) DROP TABLE dbo.Fato_Venda CREATE TABLE dbo.Fato_Venda ( Cod_Cliente INT, Cod_Produto INT, Cod_Forma_Pagamento INT, Dt_Venda DATETIME, Vl_Venda FLOAT ) DECLARE @Contador INT = 1, @Total INT = 1000 WHILE(@Contador <= @Total) BEGIN INSERT INTO dbo.Fato_Venda SELECT TOP 1 (SELECT TOP 1 Codigo FROM dbo.Dim_Cliente ORDER BY NEWID()) AS Cod_Cliente, Codigo AS Cod_Produto, (SELECT TOP 1 Codigo FROM dbo.Dim_Forma_Pagamento ORDER BY NEWID()) AS Cod_Forma_Pagamento, DATEADD(DAY, dbo.fncRand(1885), '2012-01-01') AS Dt_Venda, Preco AS Vl_Venda FROM dbo.Dim_Produto ORDER BY NEWID() SET @Contador += 1 END |
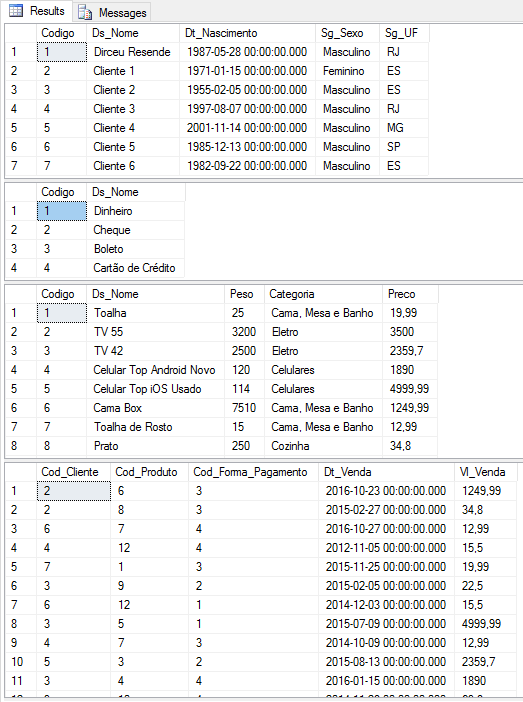
Visualizando a massa aleatória de testes:
|
1 2 3 4 |
SELECT * FROM dbo.Dim_Cliente SELECT * FROM dbo.Dim_Forma_Pagamento SELECT * FROM dbo.Dim_Produto SELECT * FROM dbo.Fato_Venda |
Criando o cubo no Visual Studio (Data Tools)
Antigamente conhecimento como Business Intelligence Development Studio (BIDS) ou Visual Studio Shell, o Microsoft Data Tools foi incorporado ao Visual Studio a partir da versão 2015 e agora fazem parte de um só produto, sendo agora apenas um plugin do Visual Studio, que pode ser baixado acessando este link.
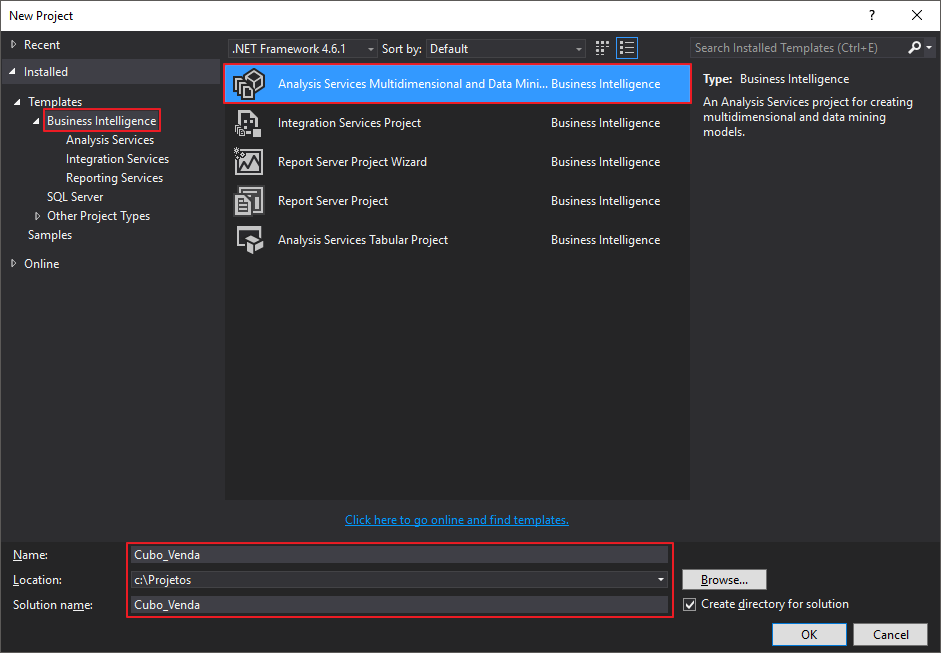
Para começar, abra o SQL Server Data Tools 2015 e no menu File > New > Project e selecione o tipo de projeto “Analysis Services Multidimensional and Datamining Project”.
Criando uma nova fonte de dados (Data Source)
Visualizar conteúdo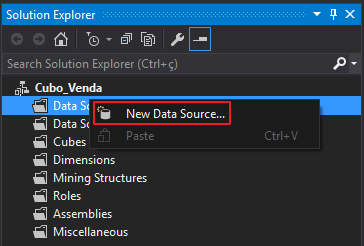
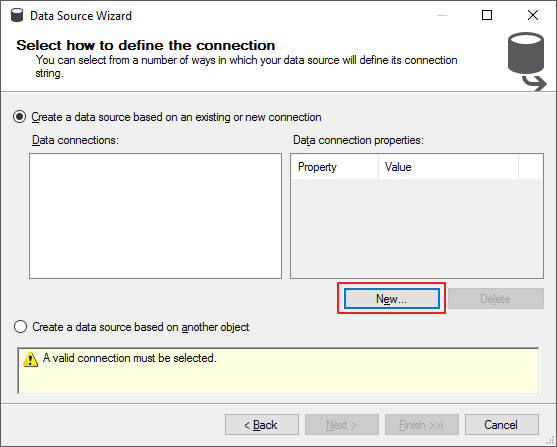
Na tela que irá abrir, clique no botão “New…” para criar uma nova fonte de dados.
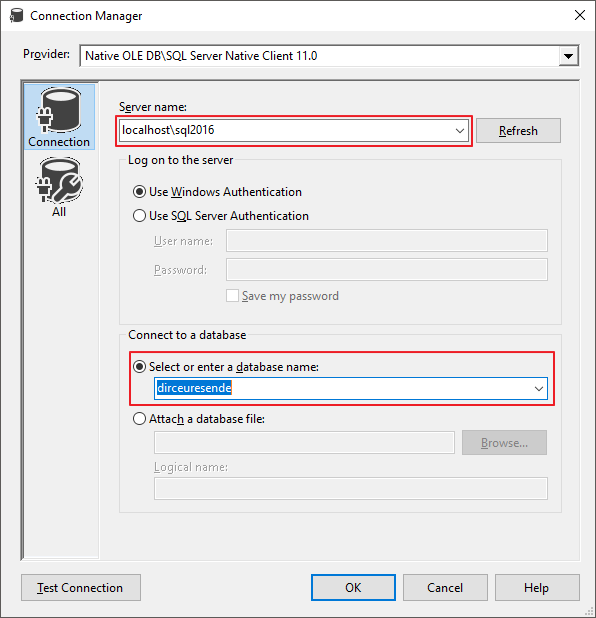
Digite o nome do servidor\instância, seu usuário de acesso e o database que os dados estão localizados
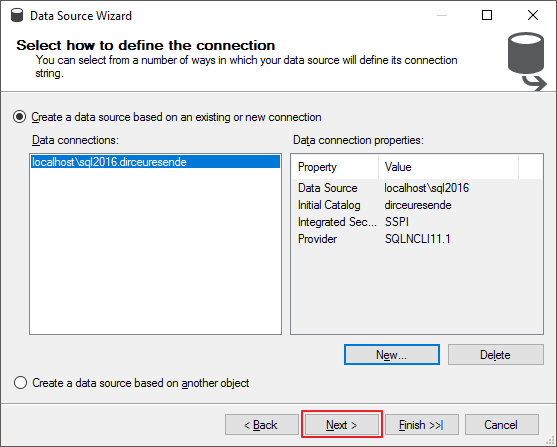
Veja que após clicar no botão de “OK”, você irá voltar para a tela anterior, que agora possui os dados preenchidos.
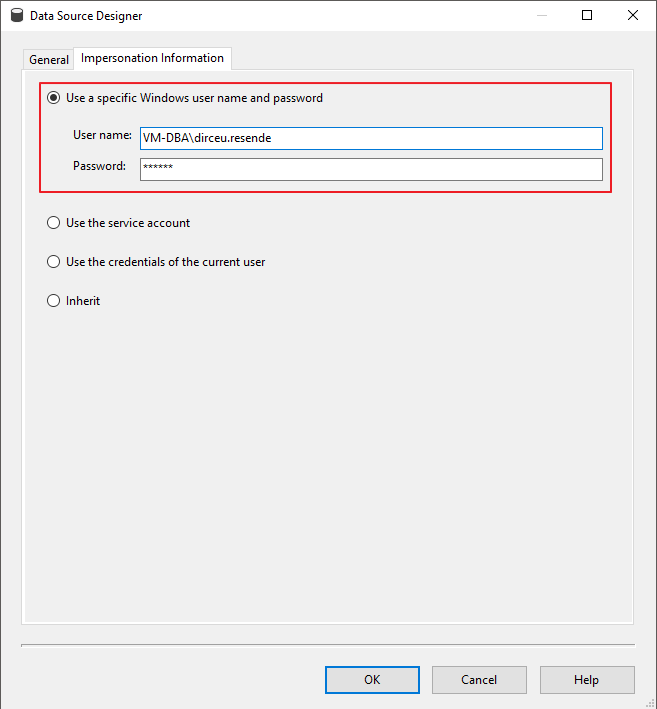
Nesta tela você poderá definir a forma de conexão do cubo do Analysis Services ao banco de dados. Geralmente utilizo um usuário do AD com permissões no database e no Analysis Services ou uma conta de serviço.
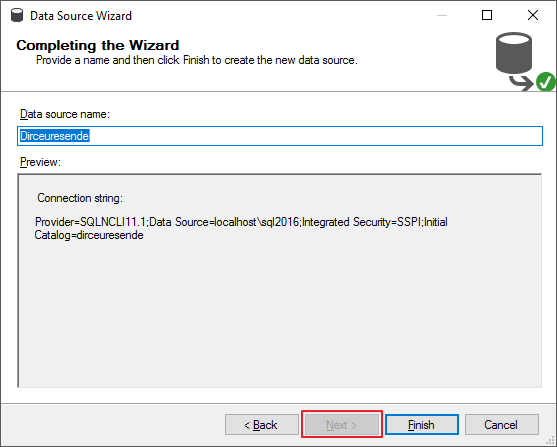
Por fim, defina o nome da fonte de dados recém criada.
Criando um novo Data Source View
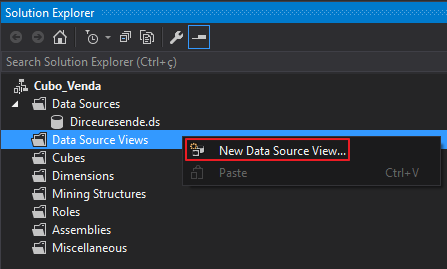
Visualizar conteúdoClique com o botão direito sobre a pasta “Data Source Views” e selecione a opção “New Data Source View…”.
Selecione a origem dos dados na lista dos Datasources previamente criados.
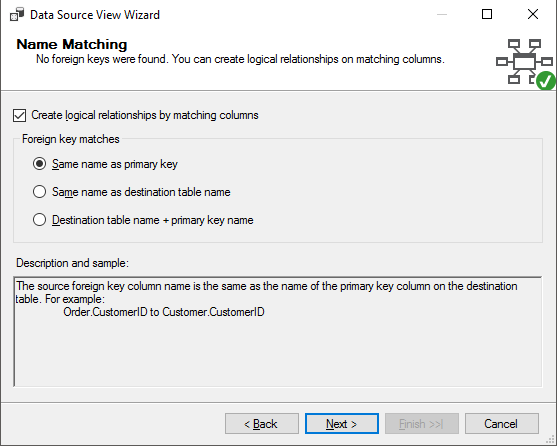
Nesta janela, defina como serão criados os relacionamentos lógicos
Selecione as dimensões e fatos que irão compor esse cubo e clique no botão marcado para adicionar as tabelas físicas no Cubo.
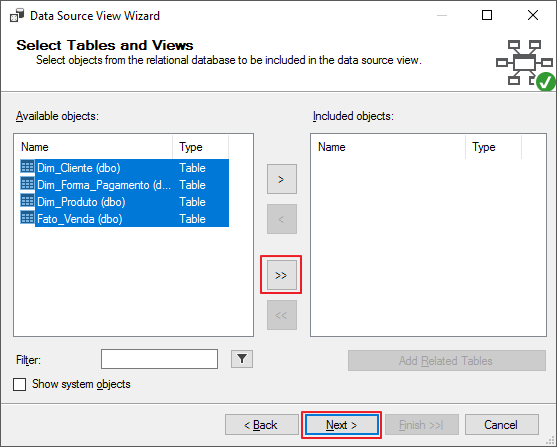
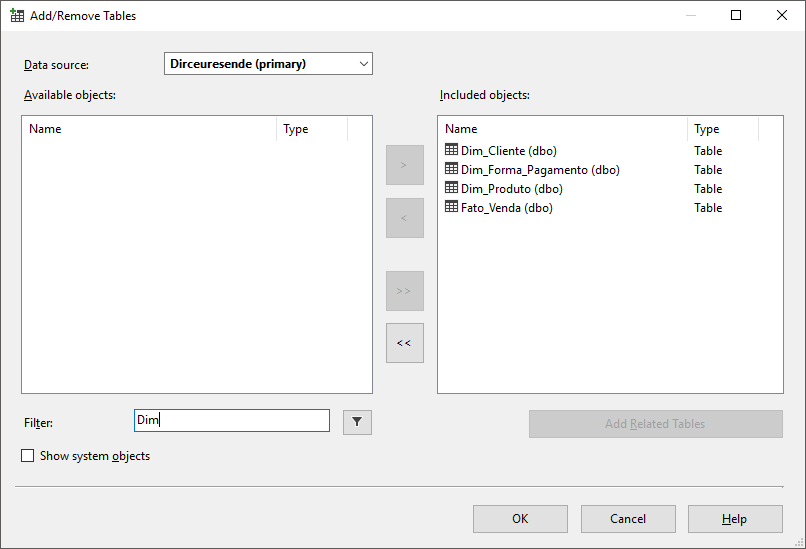
Essa tela deverá ficar assim após selecionar os objetos
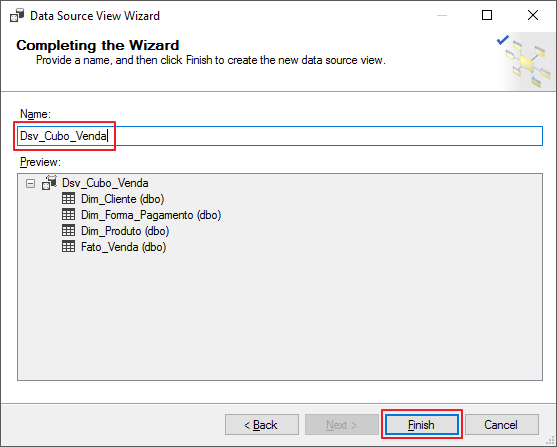
Digite o nome do Data Source View que você deseja para finalizar a criação
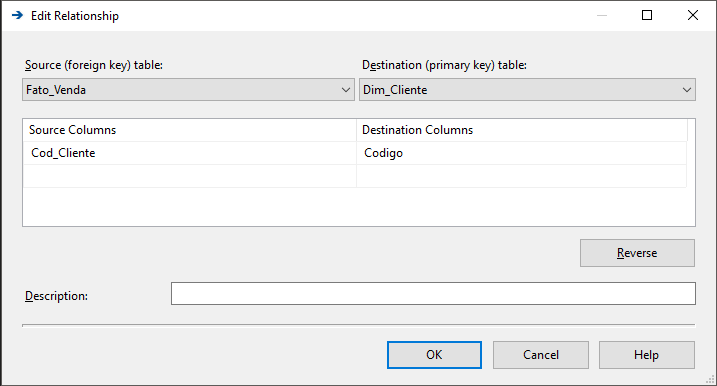
Após a criação do Data Source View, você pode criar os relacionamentos lógicos clicando na coluna da Foreign Key na Fato e arrastando para a coluna da Primary Key na dimensão. Após concluir a ação, caso não exista uma Foreign Key criada na base de dados, você verá essa mensagem de alerta:
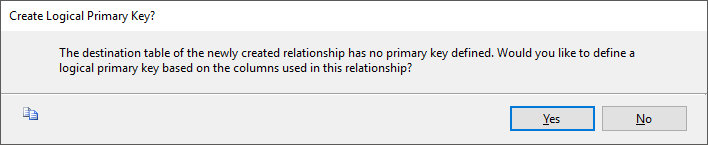
Pode criar no botão “Yes” para concluir a criação do relacionamento lógico.
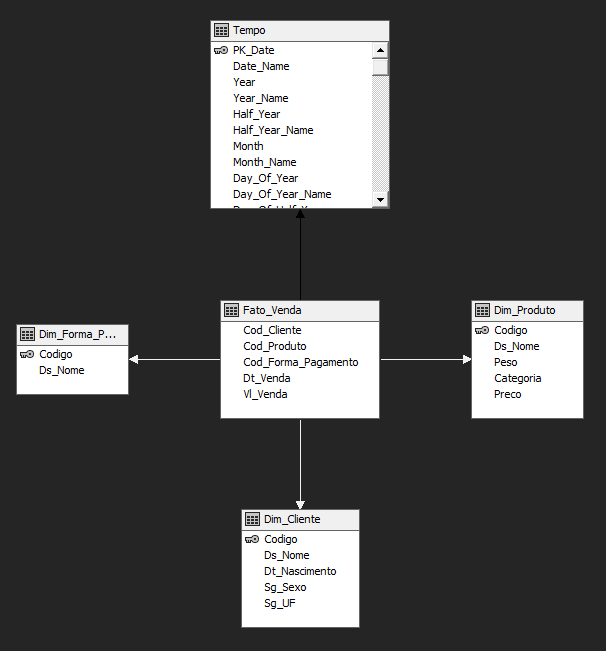
Após criar esse relacionamento de todas as dimensões, o seu datasource view ficará com essa estrutura:
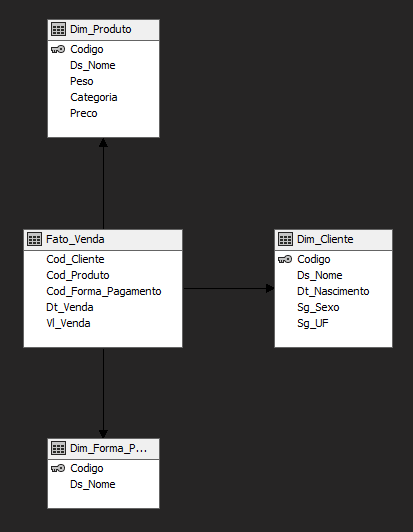
Exemplo de relacionamento entre Fato e Dimensão
Criando um novo Cubo
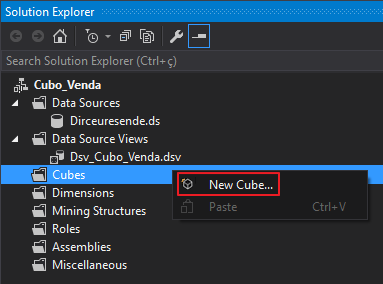
Visualizar conteúdoClique com o botão direito sobre a pasta “Cubes” e selecione a opção “New Cube..”
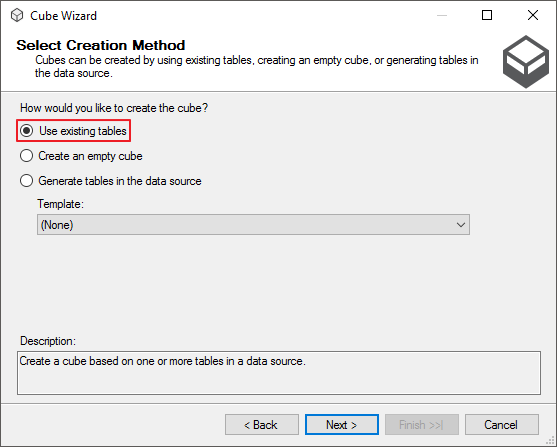
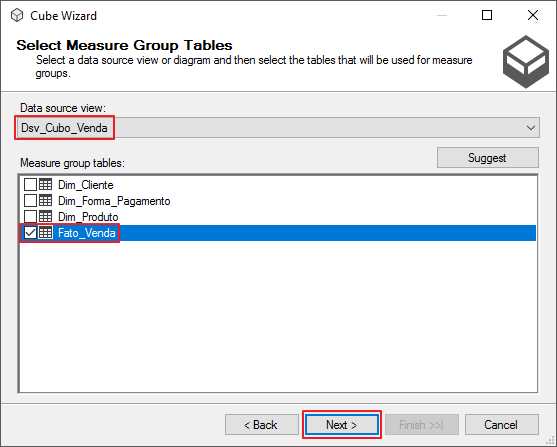
Nesta tela, você pode definir como será criado o(s) seu(s) cubo(s). Como já tenho criada a tabela Fato, vou escolher a primeira opção.
Agora você deverá selecionar a tabela Fato para formar a Measure Group do seu cubo.
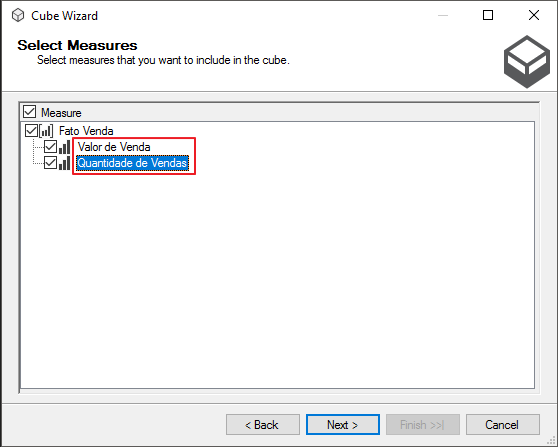
Nesta tela, você pode utilizar a tecla F2 para renomear as medidas do seu Cubo a partir da Fato.
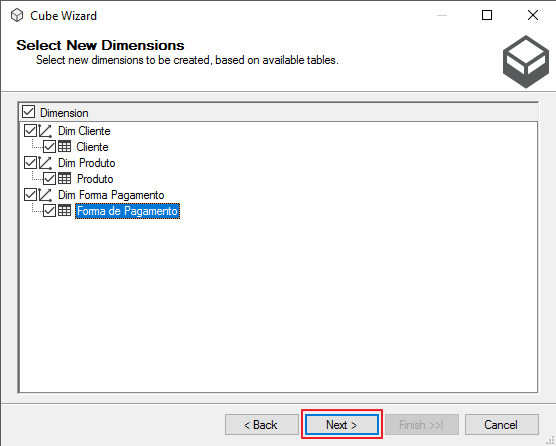
Aqui você pode escolher quais dimensões você deseja importar para o Cubo e renomear essas dimensões
Para finalizar, você pode definir o nome do Cubo
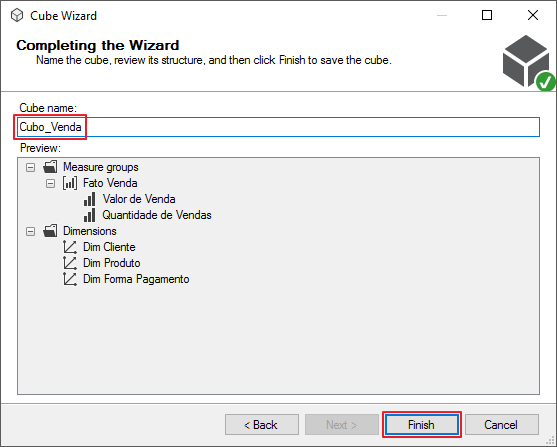
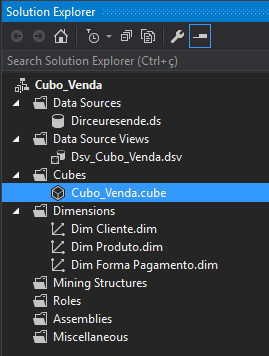
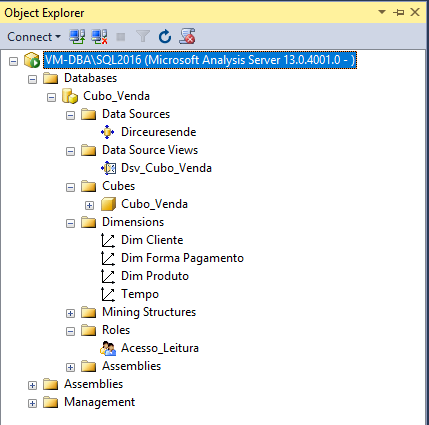
Após a criação do Cubo, essa será a nova estrutura do seu Cubo:
Gerenciando permissões
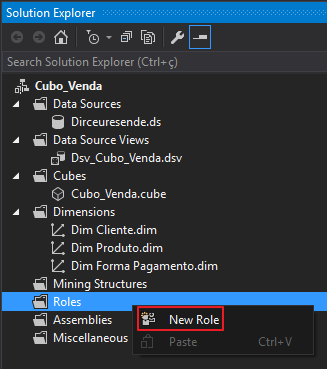
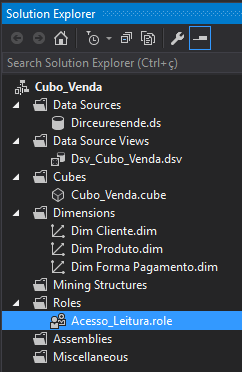
Visualizar conteúdoClique com o botão direito sobre a pasta “Roles” e seleciona a opção “New Role…”
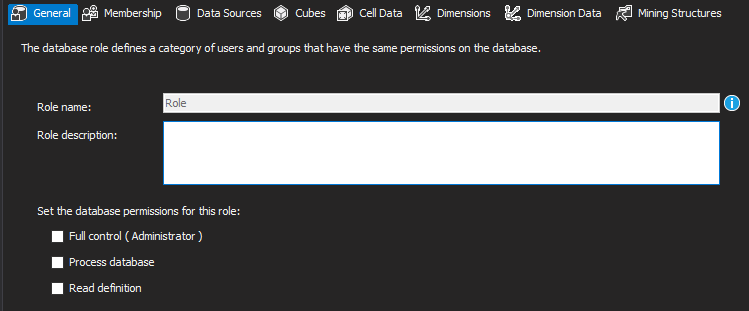
Na tela que foi aberta, você poderá definir as permissões da Role criada (O nome da role só pode ser alterado na tela de Propriedades)
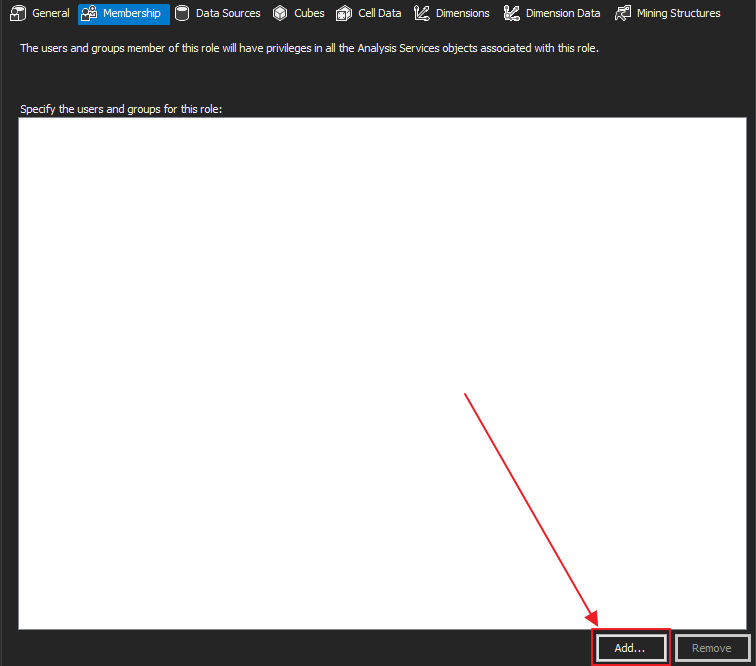
Na aba “Membership” você pode definir quem são os usuários que estão nessa role de acesso
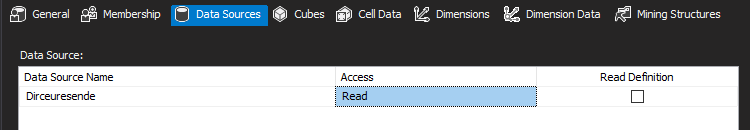
Na aba “Data Sources”, podemos definir a forma de acesso ao datasource pelos usuários da Role
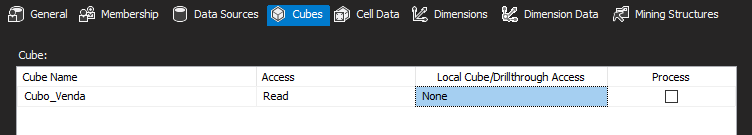
Nesta aba “Cubes” você pode definir se os membros da Role terão acesso a utilizar o Cubo no Analysis Services
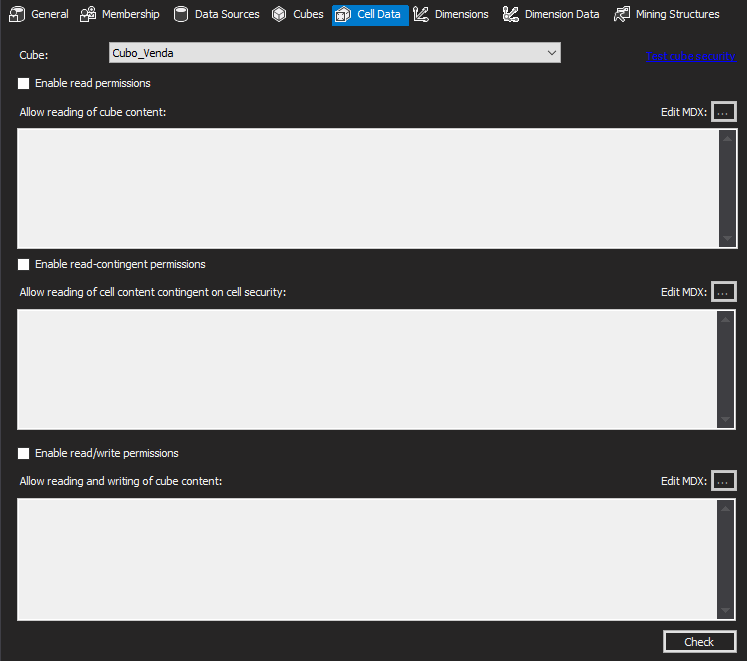
Na aba “Cell Data” podemos definir as permissões a nível de linha (célula), utilizando expressões MDX
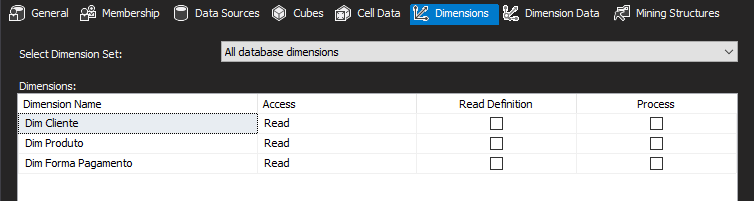
Na aba “Dimensions”, pode-se definir as permissões a nível de dimensão pelos usuários da Role.
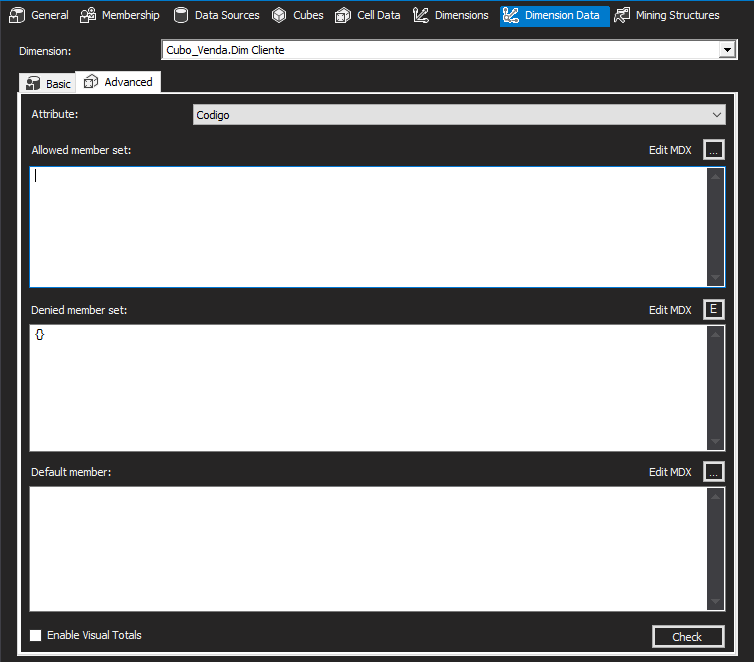
Na aba “Dimension Data” podemos definir quais linhas da dimensão os membros dessa role podem visualizar, utilizando expressões MDX
Após realizar todas as configurações de permissão, você pode alterar o nome da sua role utilizando a tecla F2 ou a opção de renomear o objeto.
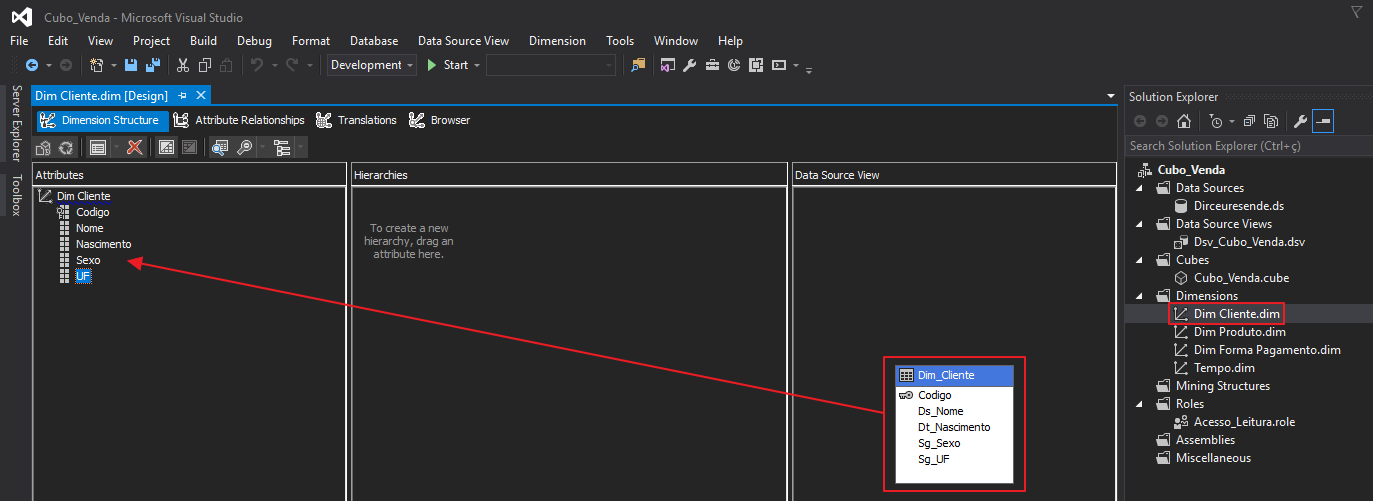
Você pode navegar pelas dimensões e adicionar mais campos da sua tabela física para sua dimensões, de modo que seja possível visualizá-las no Cubo
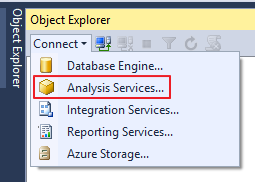
Lembre-se que essa permissão é apenas no database. Para gerenciar as permissões de Administrador do Analysis Services, você deverá abrir o Analysis Services pelo SQL Server Management Studio, selecionar a opção “Analysis Services”
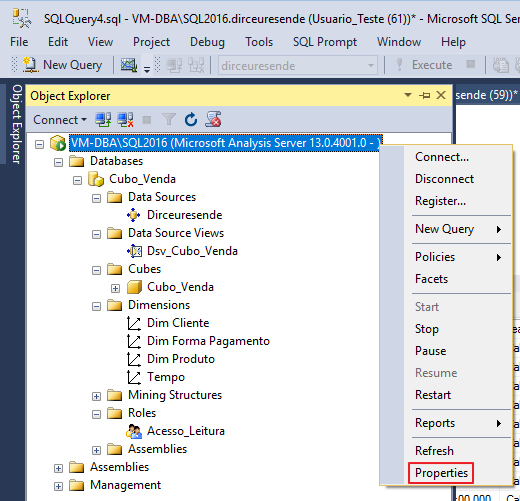
Agora clique com o botão direito do mouse sobre o ícone do Analysis Services e seleciona a opção “Properties”
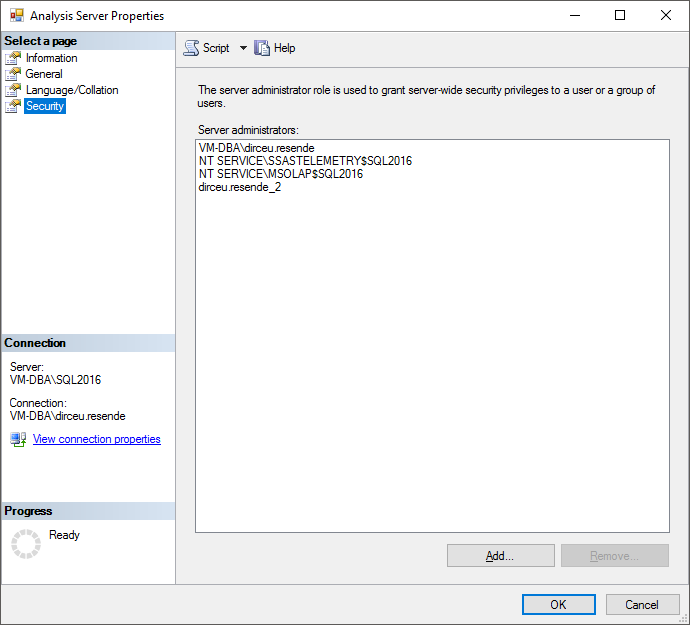
Na tela de propriedades do Analysis Services, clique na aba “Security” e pronto. Nesta tela você pode configurar quem são os administradores do Analysis Services, podendo criar/excluir/alterar todos os cubos da instância.
Criando a dimensão de Tempo
Visualizar conteúdo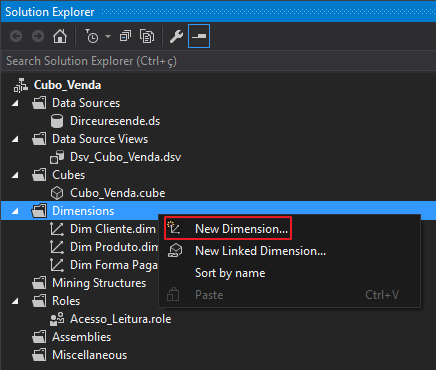
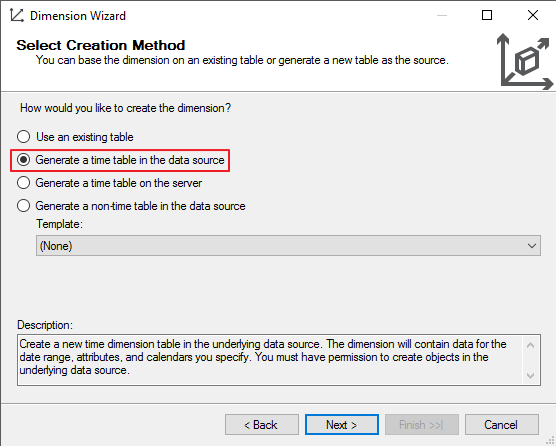
Selecione o tipo de tabela de tempo. Selecione a opção “Generate a time table in the datasource”, para que a tabela seja criada fisicamente no datasource.
Nesta tela, pode-se definir o período do calendário de datas e o nível de granularidade das datas.
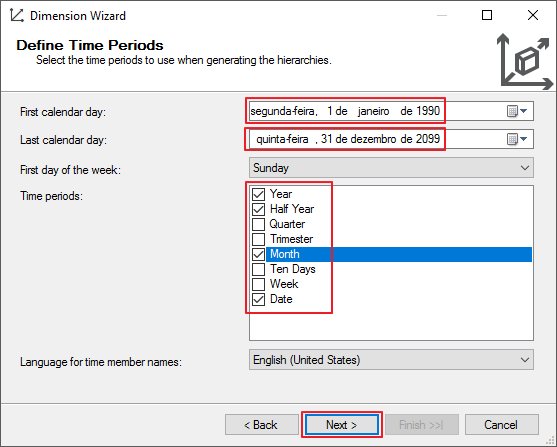
Aqui você pode definir se o seu calendário será o modelo padrão ou será personalizado, com um período de início diferente do padrão.
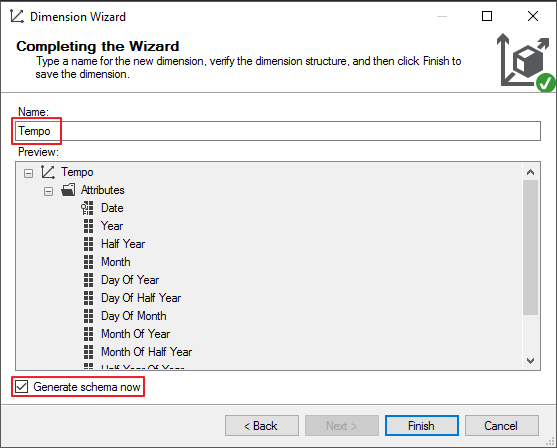
Para finalizar, selecione o nome da dimensão de Tempo e marque a opção “Generate schema now” para criar a tabela na base de dados
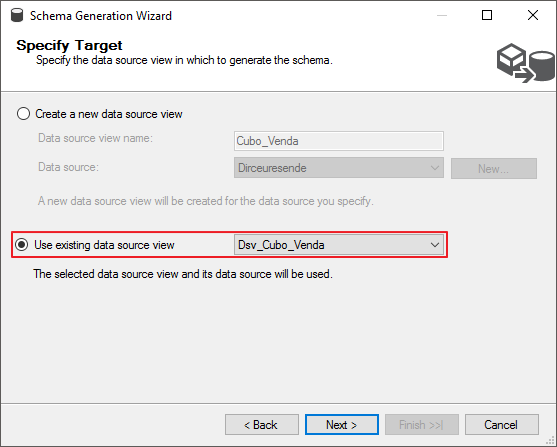
Selecione o datasource view que você deseja utilizar para criar a tabela da dimensão de Tempo no banco de dados
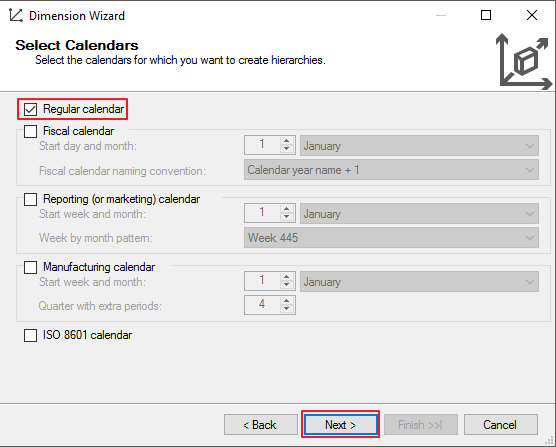
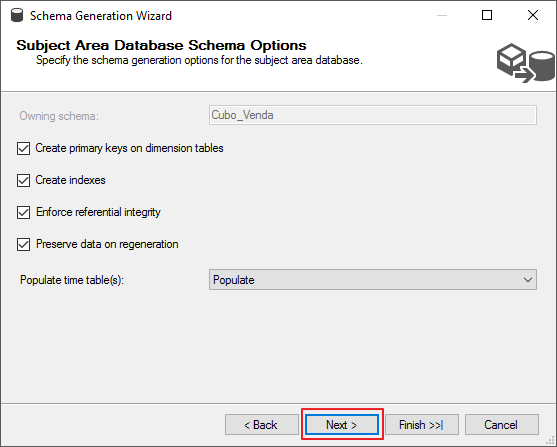
Deixe as opções padrão selecionadas, conforme o print abaixo, e clique no botão “Next”
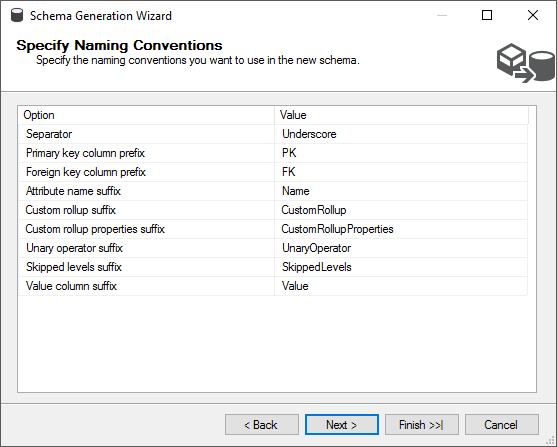
Nesta tela você pode visualiazar e definir as convenções de nomenclatura de objetos da tabela que será criada
Sumário com as alterações que serão realizadas
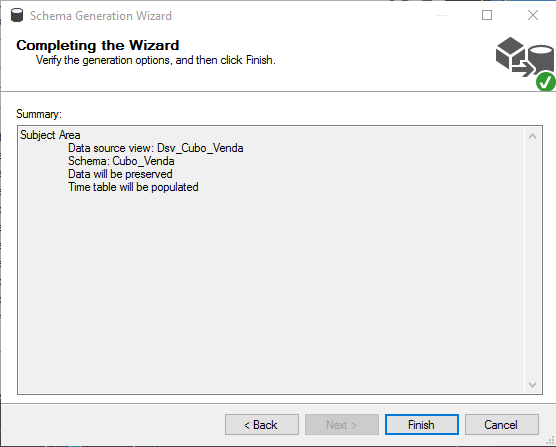
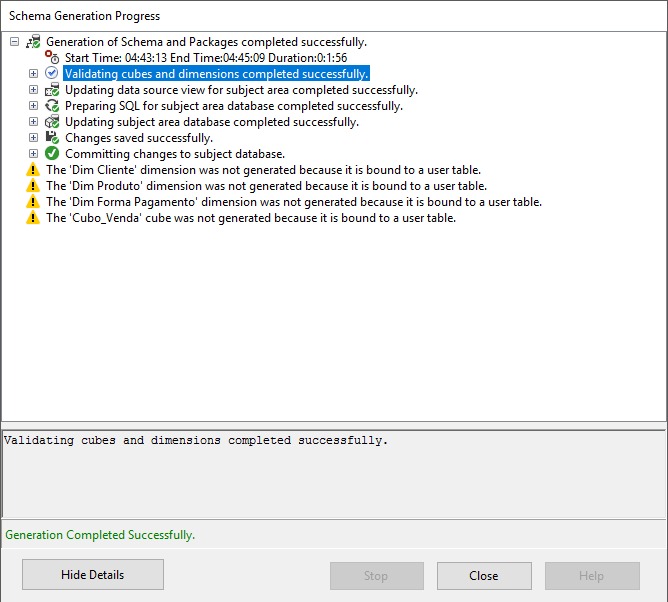
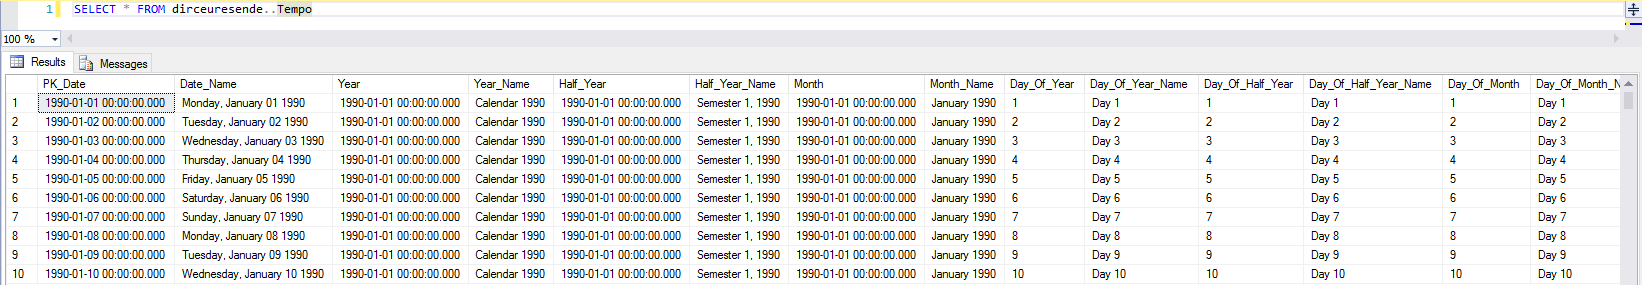
Tabela criada no banco de dados
Lembre-se de editar o Datasource view e adicionar o relacionamento entre a data na tabela Fato e a chave primária na tabela Tempo
O relacionamento deve ficar assim
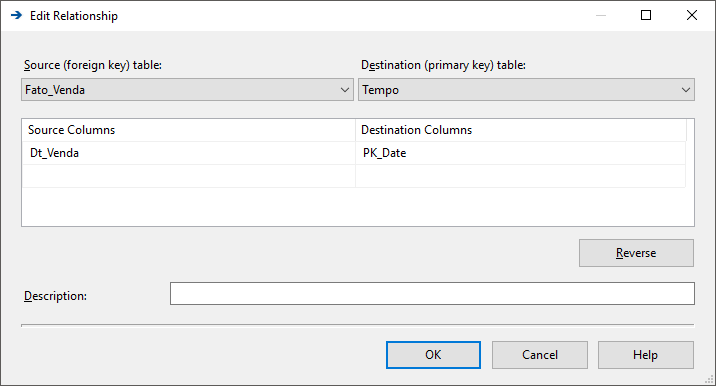
Observação: Se a data da sua tabela Fato for do tipo DATETIME com hora, você precisará remover a hora da coluna data da sua tabela Fato ou criar uma nova coluna sem a hora, pois a dimensão Tempo não possui hora, conforme exemplo abaixo, e com isso, o JOIN não será realizado corretamente (Vai retornar apenas os registros da coluna DATETIME com a hora zerada)
Processando o Cubo e Publicando no Analysis Services
Visualizar conteúdo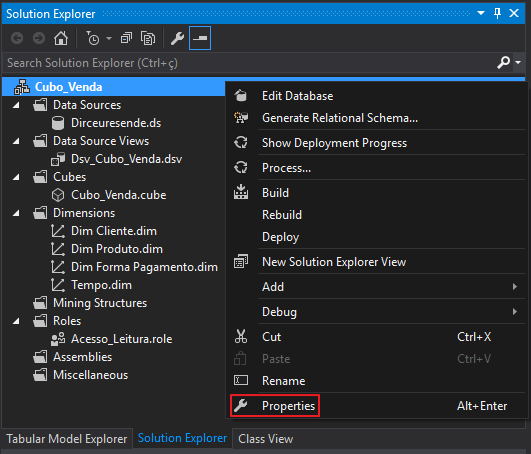
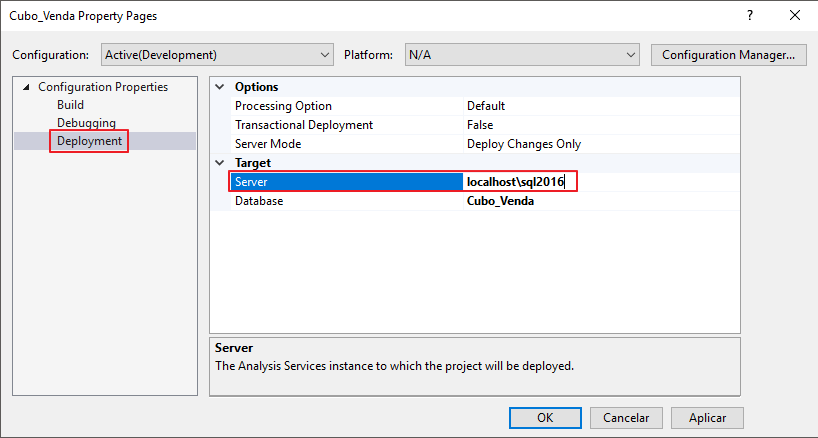
Navegue na aba “Deployment” e preencha corretamente o nome da sua instância do Analysis Services no campo Target > Server.
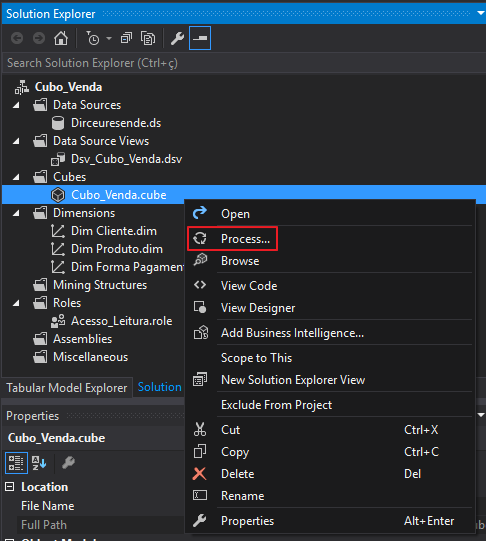
Agora que terminamos a criação dos objetos do Cubo, podemos processá-lo, que é publicar o Cubo no servidor do Analysis Services e atualizar os dados. Para isso, clique com o botão direito sobre o Cubo e seleciona a opção “Process…”
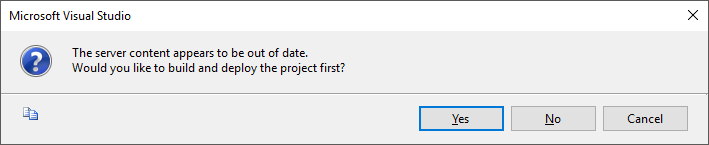
Após a solicitação de processamento, você verá a mensagem de alerta abaixo. Pode clicar no botão “Yes”.
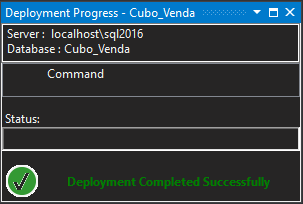
Tela indicando que o Deploy ocorreu com sucesso
Nesta tela você poderá escolher o modo de processamento e processar os dados do banco de dados para o Analysis Services
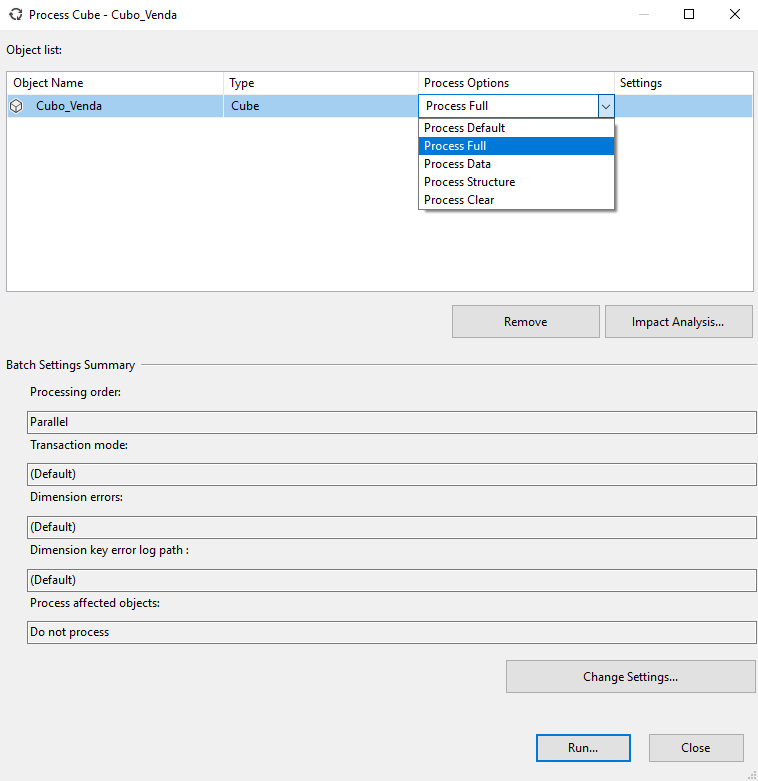
Tipos de processamento:
- Process Default: Realiza o menor esforço possível (com a menor quantidade de tarefas) para processar a estrutura e os dados. O servidor converte esta opção na mais adequada à necessidade do seu ambiente, neste momento. Aplicável: Todos Objetos
- Process Full: Processa toda a estrutura e os dados, excluindo e recriando os objetos. Isso significa que o processamento discarta tudo o que existe e cria novamente a estrutura analítica e depois processa os dados para esta estrutura. Se algum novo atributo é adicionado à dimnensão, deve rolar um process full. Aplicável: Todos Objetos
- Process Update: Quando acontece alguma alteração de atributos na dimensão, seja adicionando apagando ou atualizando, este processo deve ser executado. Tem inteligência suficiente para processar somente o diferencial da estrutura e dos dados que são novos, porém é mais lento (para aplicar a “inteligência”). Aplicável: Dimensão
- Process Data: Descarta todos os dados armazenados e processa todos os dados novamente, ignorando se houve alteração na estrutura e também nos índices. O foco são só os dados. Aplicável: Dimensão, Cubo, Measure e Partição
- Process Add (Incremental): Processa somente os novos dados, ignorando os dados que já existem e também qualquer alteração nova na estrutura ou índices. Aplicável: Dimensão e Partição
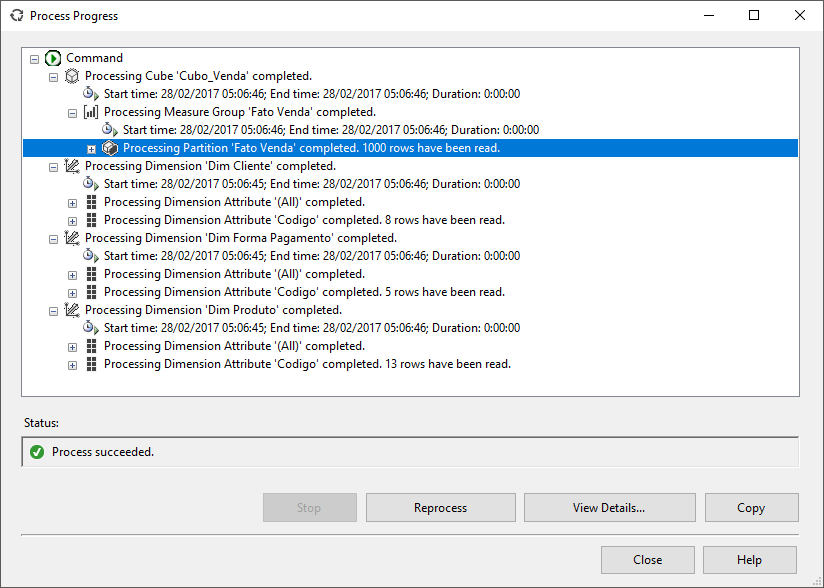
Após clicar no botão “Run”, o nosso cubo está Processado e disponível para Consultas.
Lembre-se: Qualquer alteração que seja feita no Cubo, precisará que ele seja reprocessado. Se você fizer um Process Full em uma dimensão, você precisará obrigatoriamente executar um Process Full no Cubo também.
And that's it, folks!
Abraço!


Bom dia. Parabéns pelo tutorial. Mas fiquei com uma dúvida: Quando vou processar a Dimensão está dando erro de login e senha incorretos. Já conferir os dados de acesso estão corretos, o usuario é administrador do SO e os servicos do SQL Server estão todos ativos. Tem alguma ideia do que possa ser?
Dirceu, ótimo material sobre cubo, Parabéns!
Tenho uma duvida, como que faria depois que cubos estivesse pronto e quisesse inserir um novo campo, seria preciso dar UPDATE na fato com o novo campo?
Abraços!
Ei Rafa, tudo bem?
Tem que rodar o alter table na fato pra inserir o novo campo, utilizando o update posteriormente para popular os dados do novo campo.
Depois que tem atualizar o dsv no data tools, fazer os ajustes necessários no cubo e reprocessar o cubo.
Parabéns.. muito bom.
Fico feliz em saber que você gostou 🙂
Dirceu Resende…
Pô, você é o cara! Que Deus continue abençoando voce.
Desejo tudo de bom para você de verdade. Que artigo completo e incrível. Era o que eu tava precisando.
Abraços de um angolano,
Edilásio Paulo
Bom dia.
Já faz um bom tempo que procuro um material desse, eu depois de muita pesquisa, sem dúvida nenhuma esse foi o melhor e mais completo que encontrei, só tenho a agradecer esse compartilhamento de informações.
Que Deus continue abençoando muito vocês , um grade abraço.
Marcelo,
Boa tarde.
Muito obrigado pelo seu feedback!! É isso que me motiva a continuar sempre postando.